Copper Price Analysis: Sinks almost 3%, eyeing a fall towards $3.2505 ahead of YTD lows
- Copper futures are nosediving due to fears of a worldwide economic slowdown, weighed by China’s PMI and other lockdowns in a 21.1 million city.
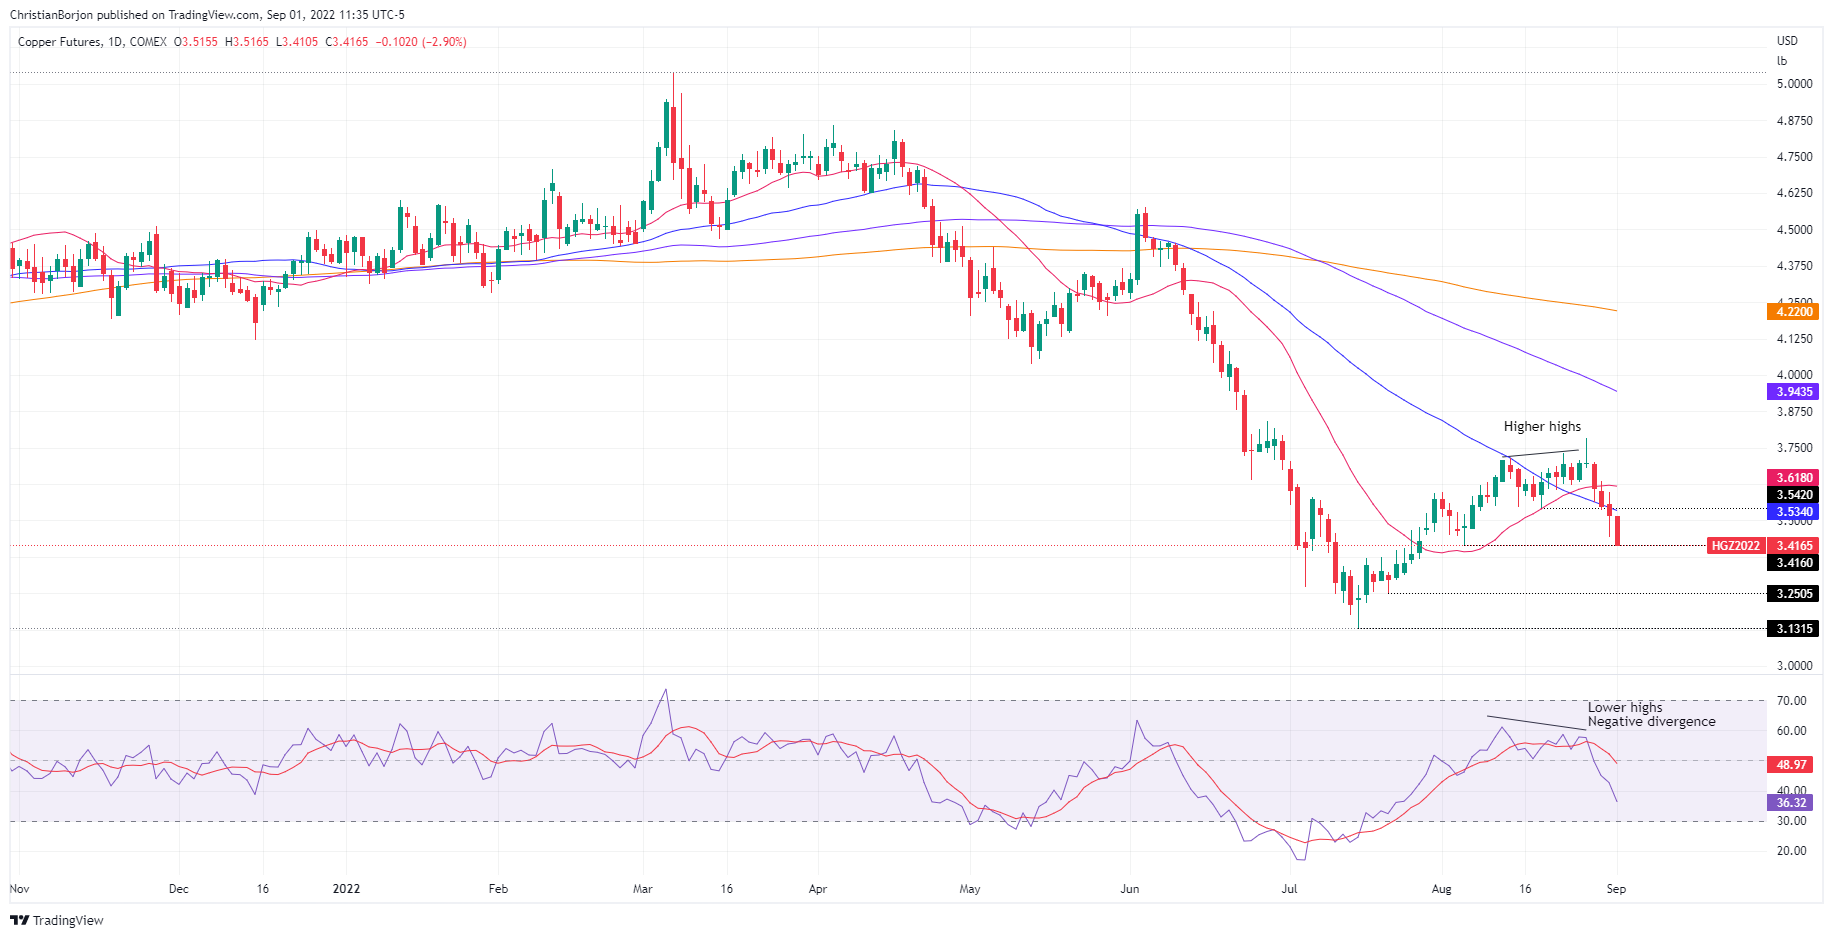
- Negative divergence in Copper’s daily chart, alongside fundamental, sent prices below the 20 and 50-DMA.
Copper futures are dropping to two-month lows at $3.4165, down almost 3%, on fears that China’s manufacturing activity contracted for the first time in three months, alongside expectations of a US economic deceleration prompted by the US Federal Reserve tightening monetary policy conditions.
Additionally, broad US dollar strength, alongside newswires that China’s Chengdu announced a lockdown of its 21.2 million residents, is a headwind for the red metal.
Also read: Copper drops from two-month highs due to global economic slowdown, speculators’ shorts
Copper Price Analysis: Technical outlook
The Copper daily chart depicts the pair as neutral-to-downward biased. It’s worth noting that the last copper article that I wrote noted that “the Relative Strength Index (RSI) recorded a successive series of lower highs, contrary to price action, meaning that prices are about to edge lower.” Since then, Copper tumbled below the 20 and 50-day EMAs, from around $3.6970. to $3.4105.
If Copper achieves a daily close below the August 4 daily low at 3.4160, it could send the red metal towards the July 21 swing low at $3.2505, followed by the YTD low at $3.1315. On the flip side, if Copper buyers reclaim the 50-day EMA at $3.6340, a re-test of the 20-day EMA at $3.6175 is on the cards.