NZD/USD Price Analysis: Renews fortnight low, stays pressured towards 0.6200
- NZD/USD takes offers to refresh multi-day low amid three-day downtrend.
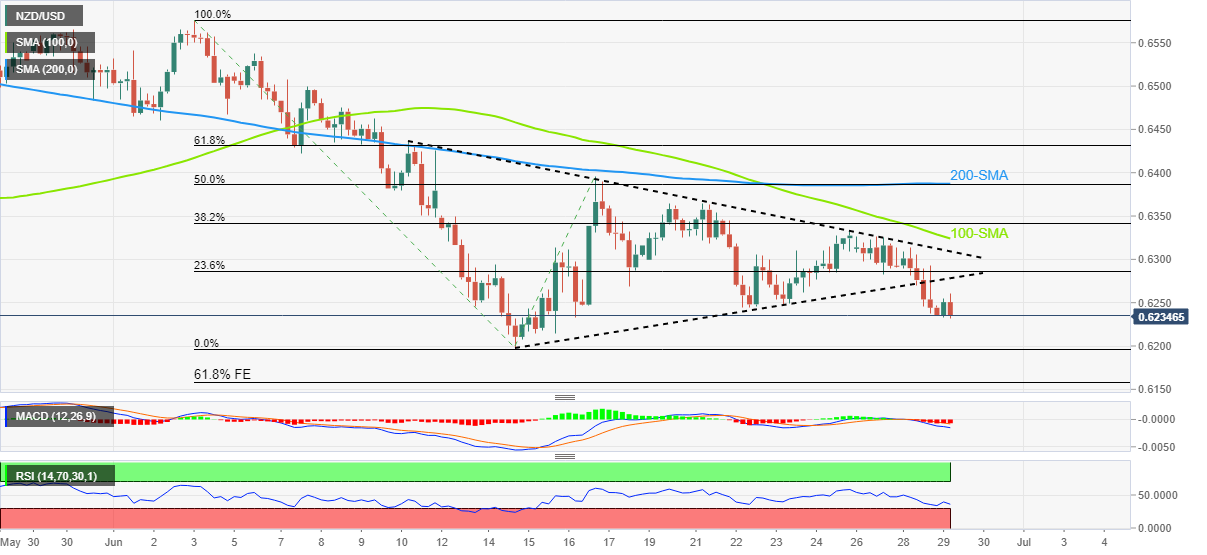
- Clear break of short-term triangle joins bearish MACD signal, sustained trading below key SMAs to favor sellers.
- Nearly oversold RSI hints at limited downside room, bulls need validation from 0.6400 to retake control.
NZD/USD drops to fresh low in two weeks, to 0.6232, during early Wednesday morning in Europe. In doing so, the Kiwi pair not only reverses the early Asian session rebound but also declines for third consecutive day.
The quote’s bearish bias takes clues from the previous day’s downside break of a fortnight-long symmetrical triangle, as well as the downbeat MACD signals, not to forget sustained trading below the key SMAs.
That said, the quote’s latest weakness eyes the monthly low around 0.6200.
However, nearly oversold RSI may challenge the NZD/UDS pair’s weakness past 0.6200, which if happens could highlight the 61.8% Fibonacci Expansion (FE) of June 03-16 moves, near 0.6160.
Alternatively, recovery remains elusive below the aforementioned triangle’s support line, now resistance around 0.6280.
Following that, the triangle’s upper line and the 100-SMA, respectively near 0.6310 and 0.6325, could challenge the NZD/USD buyers.
It’s worth noting, though, that the pair’s upside momentum hinges on its ability to cross the 0.6400 hurdle comprising the 200-SMA and the 50% Fibonacci retracement level of the early June downtrend.
NZD/USD: Four-hour chart
Trend: Further weakness expected