AUD/USD Price Analysis: Bulls looking for a correction to H1 M-formaiton neckline
- Bears are fully in control targeting a break of critical market structure.
- AUD/USD bulls looking for an optimal entry and correction opportunities.
AUD/USD is heavily offered as the US dollar continues to rally in a risk-off setting. However, corrections could be on the cards and the Aussie is testing a critical level of market structure that opens prospects of trading opportunities.
AUD/USD daily chart
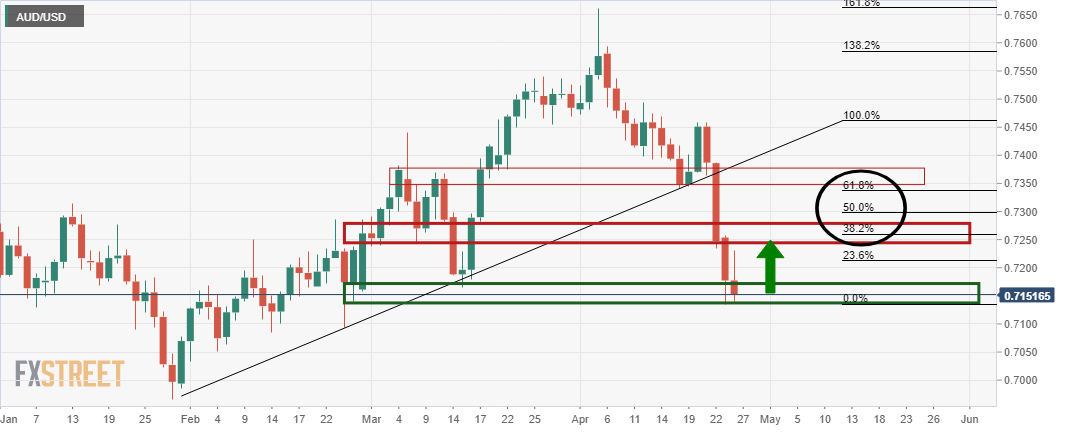
The daily chart shows that the price is firmly offered but is now meeting a daily support area that could hold and lead to a significant bullish correction. The 38.2% Fibonacci retracement level is located at 0.7258.
AUD/USD H1 chart
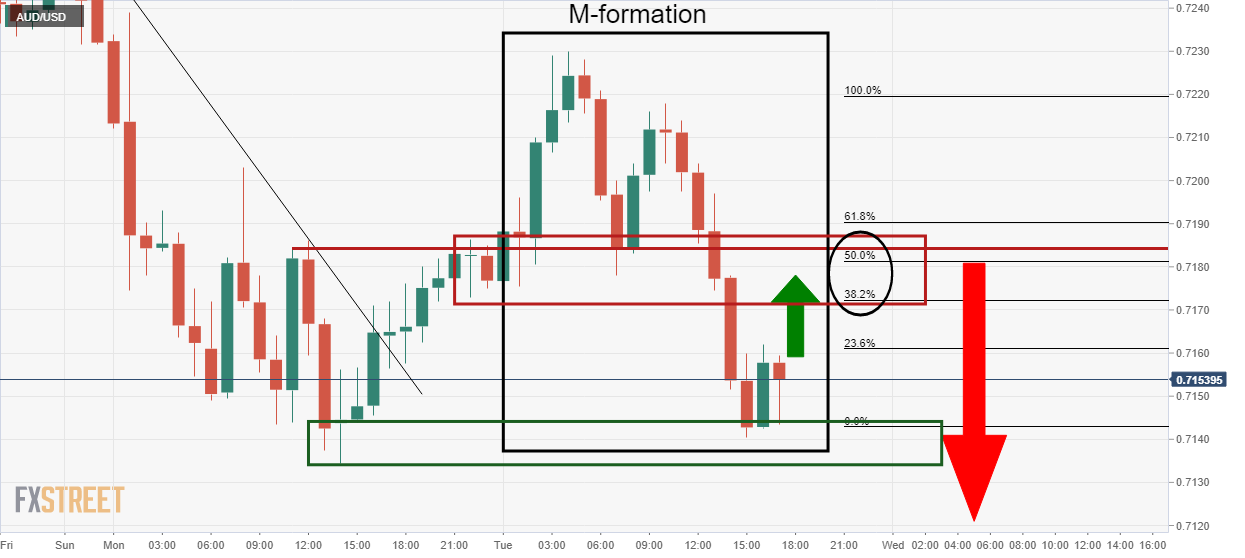
The hourly chart's M-formation is a reversion pattern. The price that has been supported at the prior lows would be expected to continue to correct towards the neckline of the pattern that has a confluence with a 50% mean reversion ratio near 0.7180.
AUD/USD M1 chart
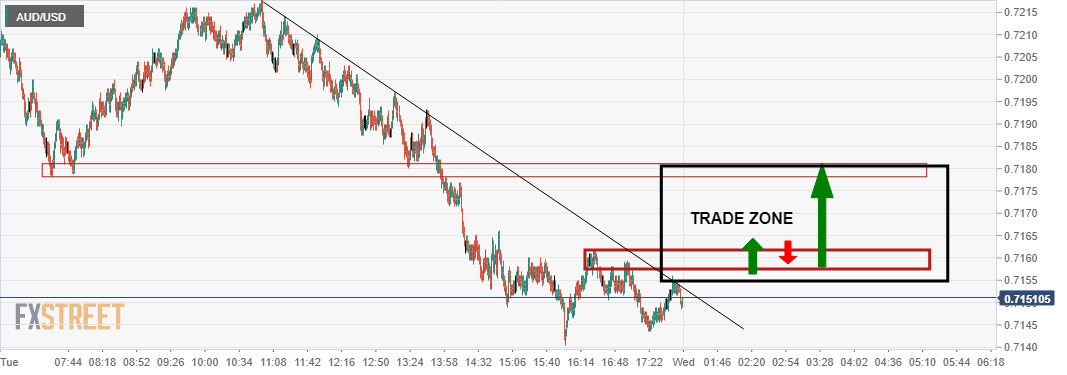
On the 1-minute chart, where scalpers are looking for trading opportunities on a very short term time frame, should the market correct towards the hourly objective, a break of the resistance will open the prospects of a rally in order to mitigate around 20 pips of the imbalance of price between there and the neckline of the M-formation.