AUD/USD Price Analysis: Bulls step aside at weekly resistance into the RBA meeting
- 0.7525 is eyed for the RBA meeting that meets the 61.8% Fibonacci retracement area.
- On the upside, weekly resistance is critical and a hawkish outcome could seal the deal for a daily upside breakout.
AUD/USD is turning a little soft as the countdown to the Reserve Bank of Australia's interest rate decision takes the spotlight. The following illustrates the market structure from both a longer-term and shorter-term outlook into the meeting.
AUD/USD daily chart
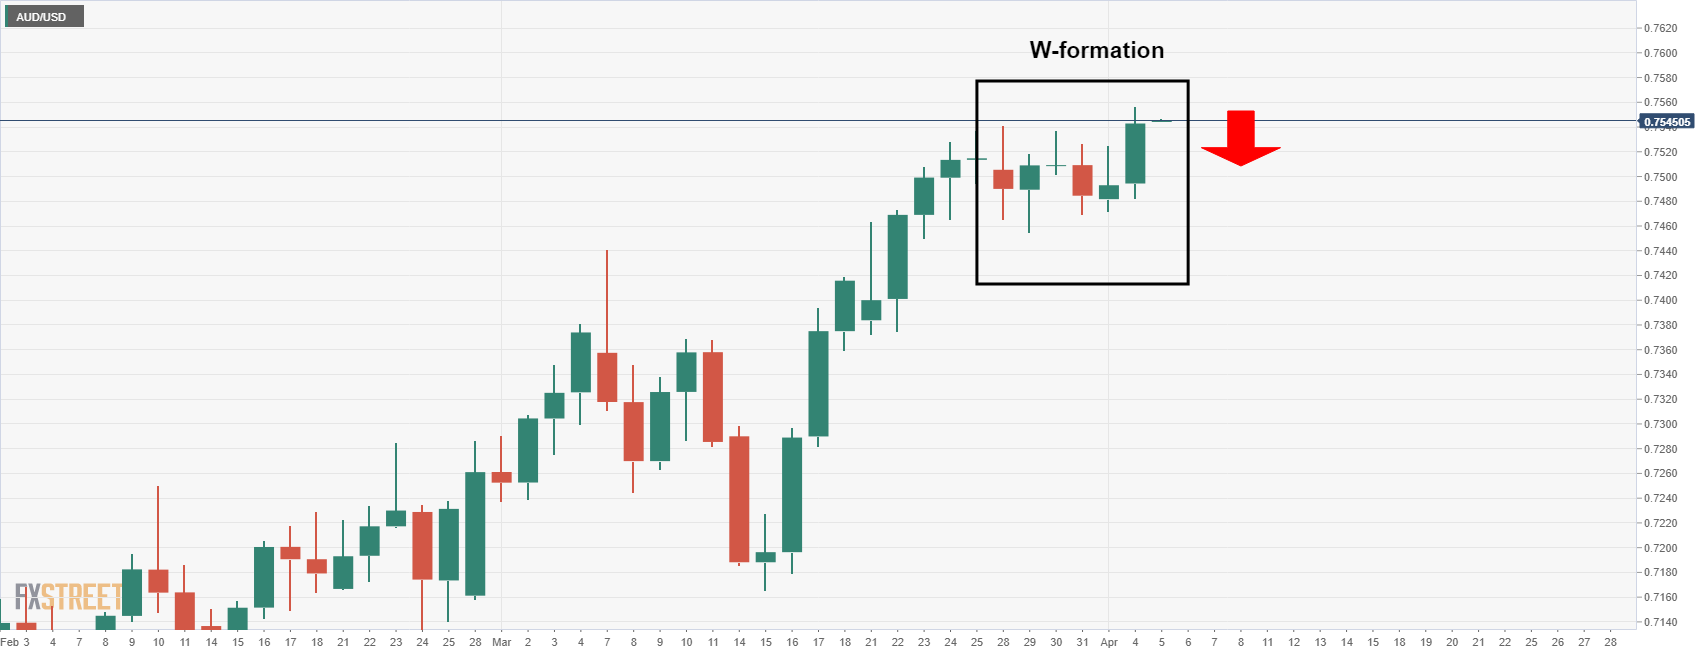
The M-formation is a reversion pattern that would be expected to result in the price reverting to the neckline of the formation, in this case, 0.7510.
AUD/USD weekly chart
This would coincide with the weekly resistance as follows:
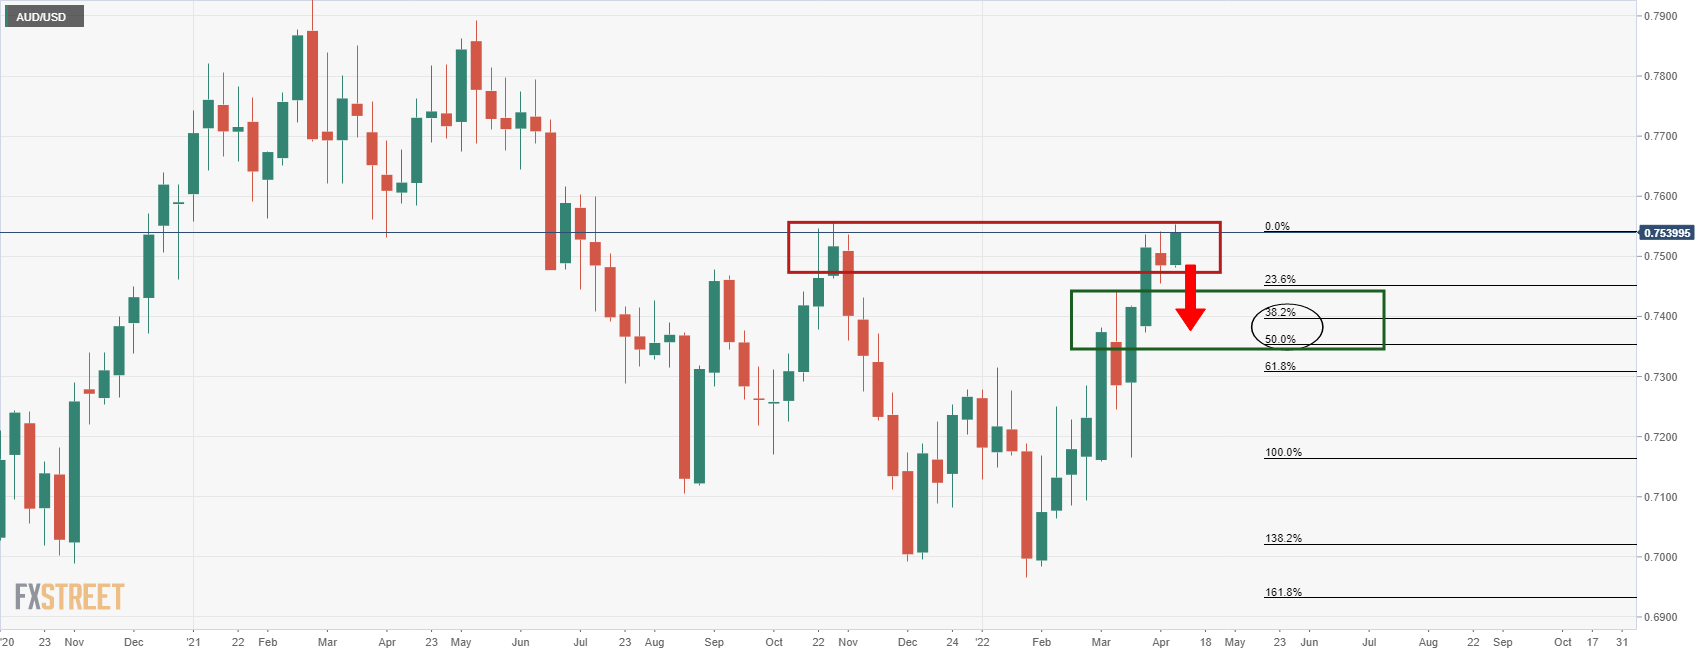
The price is meeting a wall of resistance on the weekly chart and should this hold up, then a revisit to the start of March highs could be in order where the open met with the current 50% mean reversion level near 0.7355.
AUD/USD H1 chart
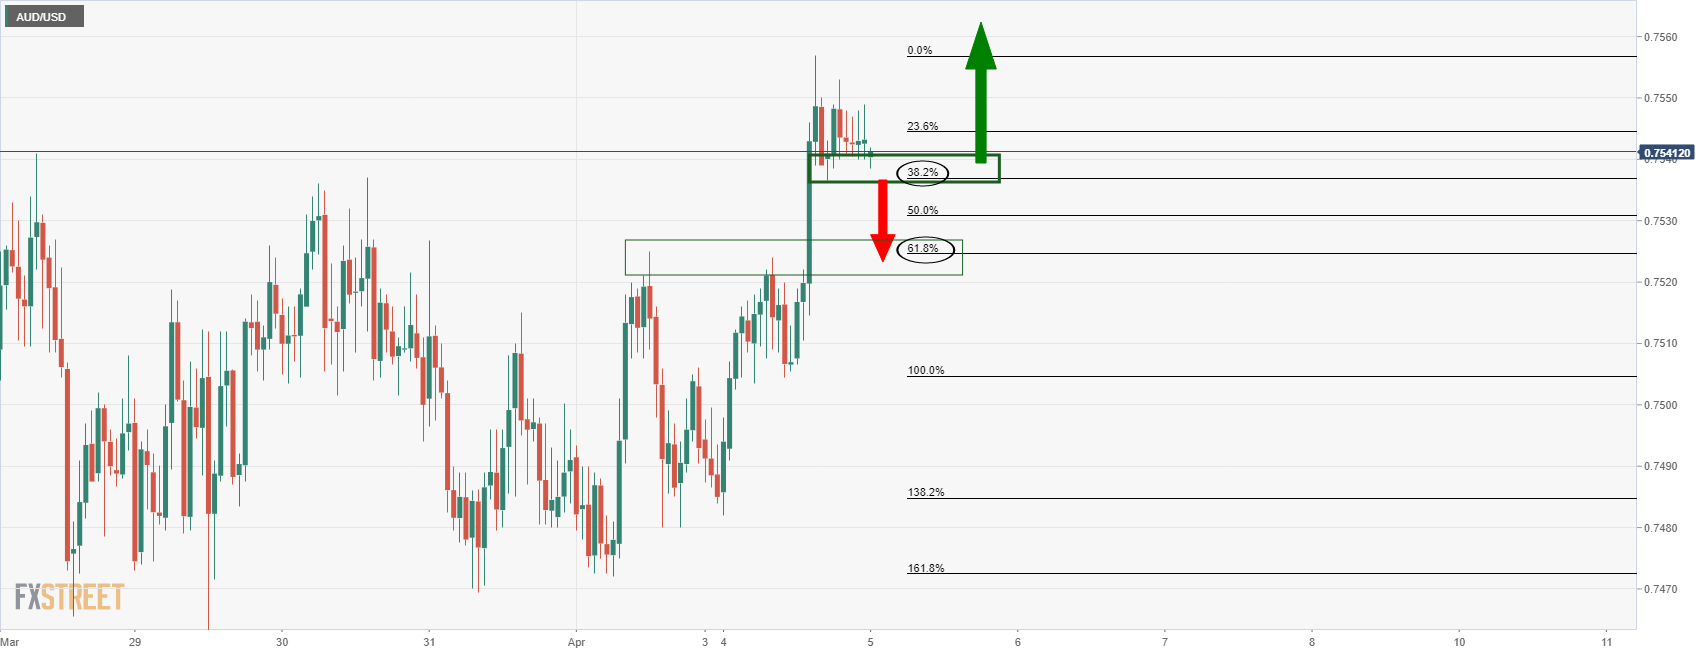
The hourly chart shows that the price has already met a 38.2% Fibonacci level from where repeated failures are tipping the balance into the hands of the bulls, at least from a short term perspective. However, a break here will open the risk of a quick move into the prior resistance near 0.7525 that meets the 61.8% Fibonacci retracement area.