US Dollar Index (DXY): Clings to 98.000 amid a dismal mood an appetite for safe-havens
- The US Dollar Index finished March with gains of 1.65%, boosted by a negative market mood.
- An extension of the Russia-Ukraine conflict could benefit safe-haven assets.
- Money market futures have priced in a 69.9% chance of a 50 bps rate hike by the Fed in the May meeting.
- DXY Price Forecast: The bias is upwards, but a break below 97.802 would open the door for further losses.
The US Dollar Index, a gauge of the greenback value against a basket of six currencies, also known as DXY, finished March positively, with a monthly gain of 1.65%, its highest since November of 2021. At press time, the US Dollar Index sits at 98.348.
The market mood on March’s last trading day was dismal. Failure to find a meaningful resolution to the Russia-Ukraine conflict keeps investors on their toes, boosting the buck’s prospects. Also, money market futures expectations that the Federal Reserve would hike 50-bps in May and June meetings loom, keeping the US dollar tilted upwards.
The CME FedWatch Tool has priced in a 69.9% chance of a 50 basis point rate hike in the May meeting, while June odds lie at 64%.
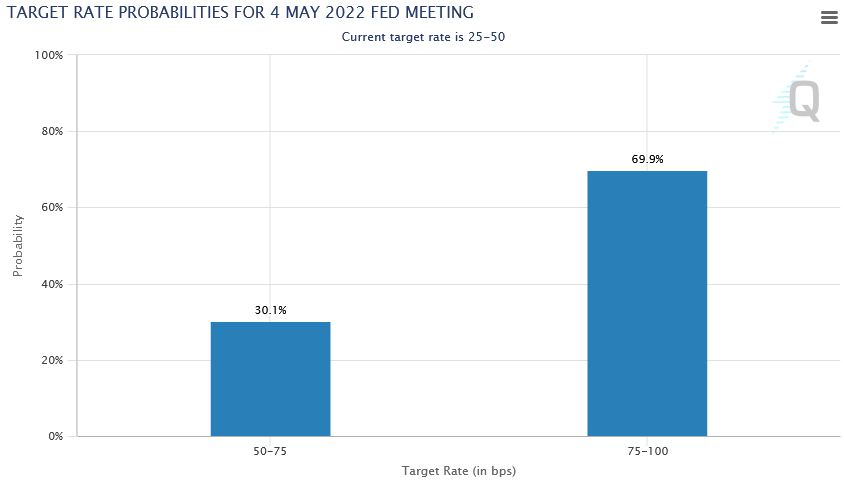
Source: CME FedWatch Tool
Thursday’s US economic docket featured the US Personal Consumption Expenditure (PCE), the favorite measurement of inflation of the Federal Reserve, for February, which rose by 6.4% y/y, higher than the previous 6% reading. Meanwhile, Core PCE, which excludes volatile items, rose by 5.4% y/y, better than the 5.5% foreseen by analysts.
At the same time, the US Department of Labor revealed Initial Jobless Claims for the week ending on March 26. The figure came at 202K, worse than the 197K estimated.
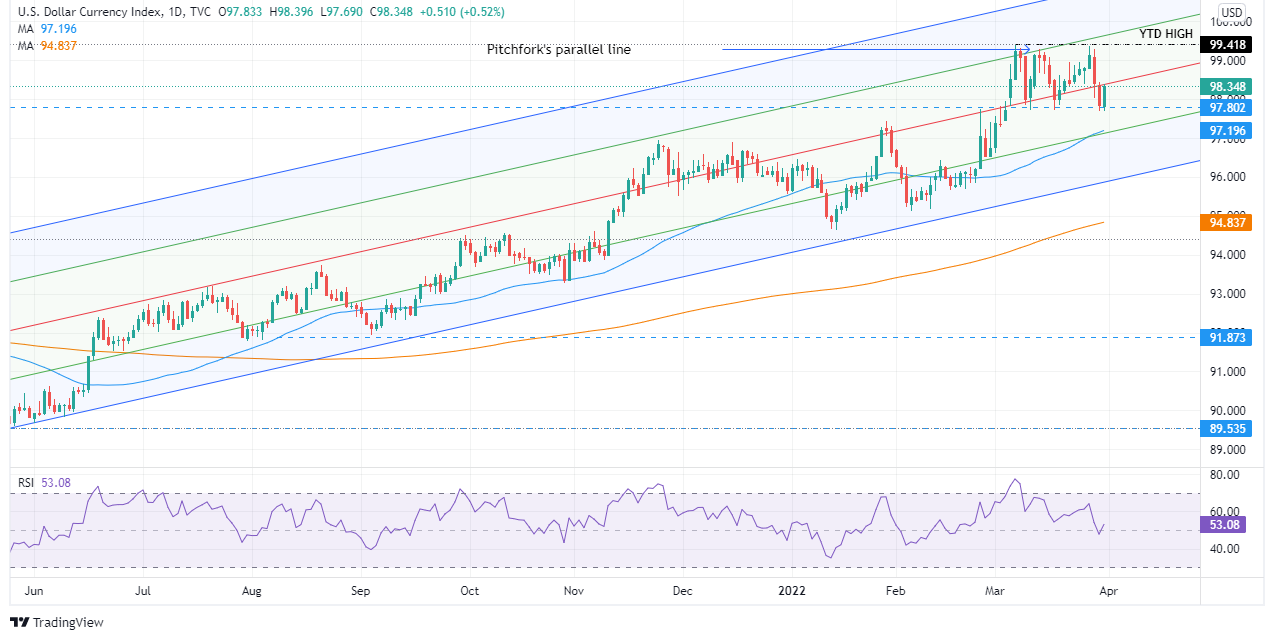
DXY Price Forecast: Technical outlook
The US Dollar Index remains upward biased but consolidates around the 97.800-99.418 range. The 50 and 200-day moving average (DMA) remain below the price with an upslope, meaning that the uptrend is still intact.
On the upside, the DXY first resistance is the 99.000 mark. Breach of the latter would expose the YTD high at 99.418, followed by the psychological 100.00 mark.
On the flip side, the DXY first support would be 98.000. A decisive break would expose 97.802, which in case of being broken, would pave the way towards 96.000, but it would find some hurdles on its way down. The following support would be the 50-DMA at 97.196, followed by 96.000.
Technical levels to watch