29 Mar 2022
US Dollar Index Price Analysis: A potential test of 97.70 now picks up pace
- DXY plummets to multi-day lows and challenges 98.00.
- Decent contention is seen around the 97.70 region.
The index accelerates losses and trades close to the 98.00 mark following encouraging news from the geopolitical landscape.
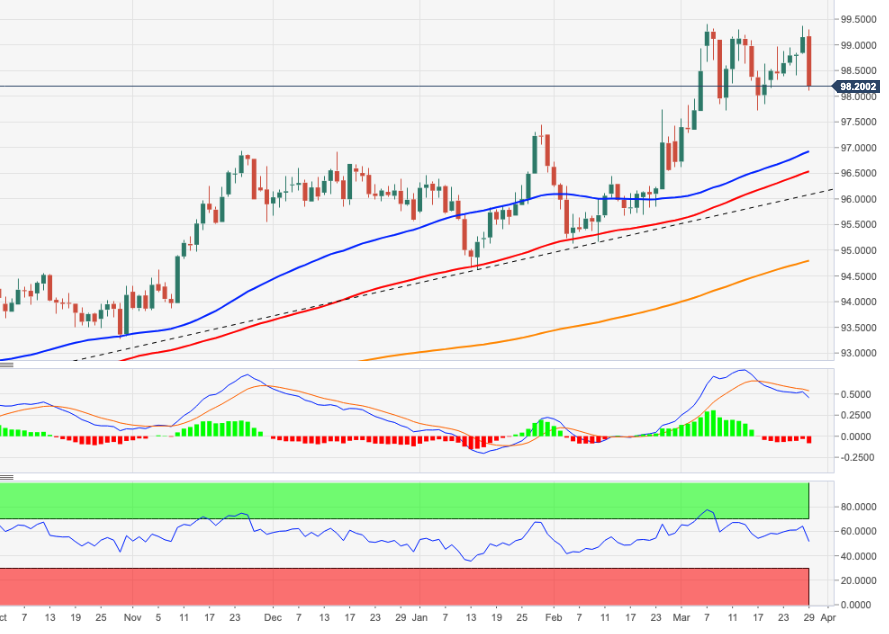
The continuation of the decline carries the potential to break below the key support at 98.00 and drag DXY lower to visit the weekly lows around 97.70 (March 10, 17).
The current bullish stance in the index remains supported by the 6-month line just near 96.10, while the longer-term outlook for the dollar is seen constructive while above the 200-day SMA at 94.77.
DXY daily chart