GBP/USD Price Analysis: Monthly resistance probes bounce off 200-SMA, 50% Fibo.
- GBP/USD picks up bids to pare intraday losses, mainly due to the sudden risk-off play.
- Russian media spreads news of Ukraine’s violation of ceasefire, Ukraine military rebels were marked responsible elsewhere.
- Bullish MACD signals favor further upside but a short-term resistance line test buyers.
- Key Fibonacci retracement levels add to the trading filters inside nearby trading range.
GBP/USD reverses the latest losses towards regaining the 1.3600 threshold, around 1.3585 heading into Thursday’s London open.
The cable pair initially dropped 60 pips on news that Ukrainian forces Ukraine fired mortar shells and grenades on Luhansk People's Republic (LPR) locations, per Sputnik.
Read: Breaking: S&P 500 futures drop as Ukraine's military fires mortar shells and grenades at four LPR locations
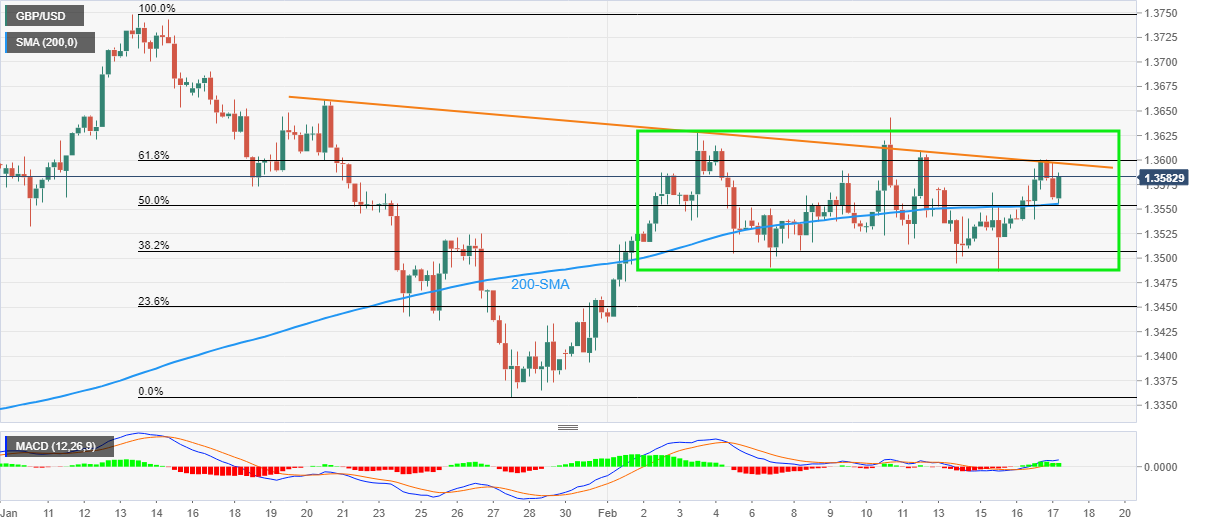
However, a convergence of the 200-SMA and 50% Fibonacci retracement (Fibo.) of January 13-27 downside, around 1.3550, triggered the quote’s corrective pullback that currently aims for a downward sloping trend line from January 20, near 1.3600.
Although the bullish MACD signals keep buyers hopeful, 61.8% Fibo. adds to the upside filters around 1.3605 to challenge the quote’s further advances.
In a case where GBP/USD rises past 1.3605, the upper line of the monthly trading range near 1.3630 will test the buyers.
Meanwhile, pullback moves below 1.3550 support confluence will aim for the 38.2% Fibonacci retracement and lower end of the nearby range, around 1.3510 and 1.3480 respectively.
During the GBP/USD weakness past-1.3480, 23.6% Fibo. level of 1.3450 may test the bears before directing them to January’s low of 1.3357.
GBP/USD: Four-hour chart
Trend: Further upside expected