WTI Price Analysis: Drops below $93.00 as overbought RSI, seven-month-old resistance test bulls
- WTI crude oil retreats from the highest levels last seen during September 2014.
- Overbought RSI conditions, failure to cross key resistance hint at further pullback.
- 10-DMA, yearly support line restrict further downside, late 2014 peaks can challenge bulls on the way to $100.00 threshold.
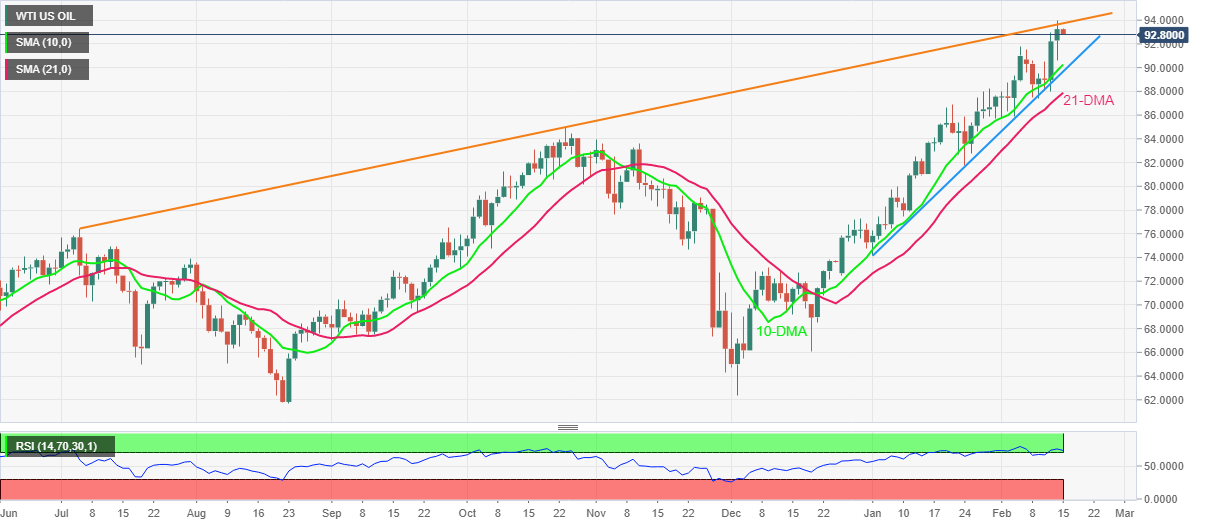
WTI eases to $92.80, down 0.45% intraday during Tuesday’s Asian session. In doing so, the black gold portrays a pullback from an ascending resistance line from July 2021 amid overbought RSI conditions.
That said, the energy benchmark refreshed a multi-day high while poking $94.00 level, the highest since September 2014, the previous day.
Given the RSI conditions and the failure to cross the key hurdle, WTI may witness further profit-booking around multi-day tops.
However, the bears may remain cautious until witnessing a clear downside break of the October 2021 peak surrounding $85.00.
Before that, 10-DMA and an upward sloping support line from January, respectively around $90.30 and $89.70, may challenge sellers. Also acting as a downside filter is the 21-DMA level of $87.88.
Alternatively, a clear upside break of the stated resistance line, around $93.80, needs validation from the recent high close to $94.00 to convince buyers.
Even so, multiple highs marked during late 2014 around $94.00 and $95.00 will offer a bumpy road to the oil bulls.
WTI: Daily chart
Trend: Pullback expected