GBP/JPY Price Analysis: Falling wedge teases buyers, 156.50 is the key hurdle
- GBP/JPY hovers around intraday high during the first positive day in three.
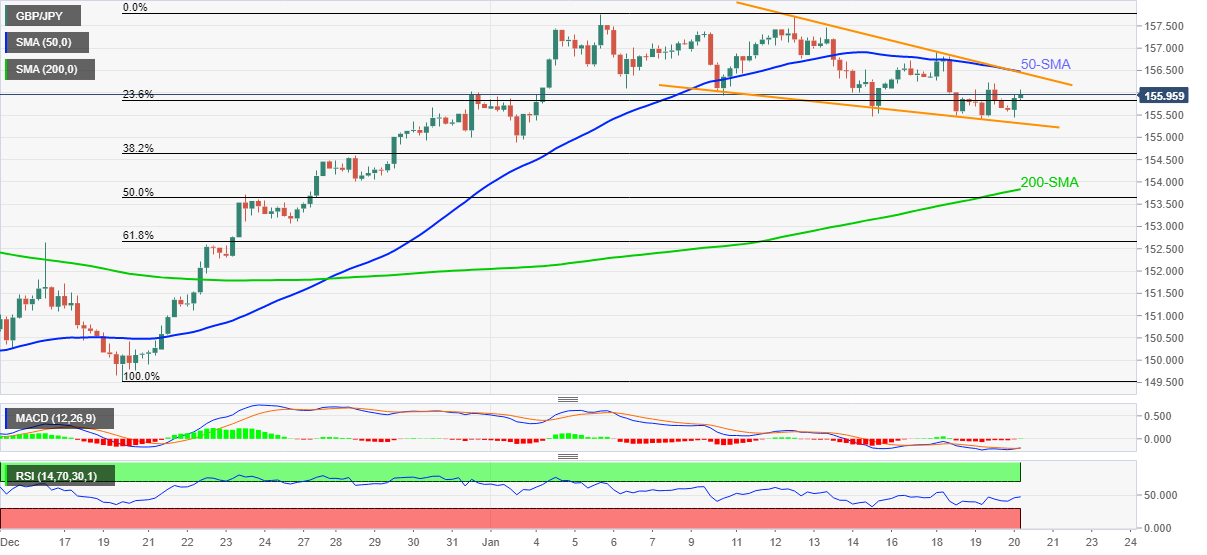
- Bullish chart pattern on 4H needs validation, 50-SMA adds strength to resistance.
- Key Fibonacci retracement levels, 200-SMA act as an additional downside filters.
GBP/JPY seesaws near the daily top of 156.06, up 0.24% intraday heading into Thursday’s London open.
The cross-currency pair rises for the first time in three days while picking up bids inside an eight-day-old falling wedge bearish chart pattern.
Given the gradually rising MACD line from the bearish territory, coupled with the firmer RSI, the GBP/JPY rebound is likely to last longer.
Though, a convergence of the 50-SMA and the upper line of the stated wedge, near 156.50, becomes crucial resistance for the GBP/JPY bulls to watch.
Should the quote rises past 156.50, the monthly high of 157.76 will act as a buffer during the theoretically anticipated rally towards crossing the 2021 peak of 158.22.
On the flip side, the wedge’s support line near 155.35 limits the short-term downside of GBP/JPY ahead of 50% Fibonacci retracement (Fibo.) of December-January upside, near 153.65.
Also challenging the GBP/JPY bears is the 200-SMA level near 153.80, as well as 61.8% Fibo. of 152.67.
Overall, GBP/JPY is up for further advances and the bullish chart pattern hints at the quote’s rally past the 2021 peak until it stays above 200-SMA.
GBP/JPY: Four-hour chart
Trend: Further upside expected