US Dollar Index Price Analysis: DXY bears aim for 94.50
- DXY remains sidelined around nine-week low, pauses two-day downtrend.
- Sustained break of previously key supports join bearish MACD signals, downbeat RSI to favor sellers.
- 100-DMA lures short-term bears, tops marked since late September offer strong support.
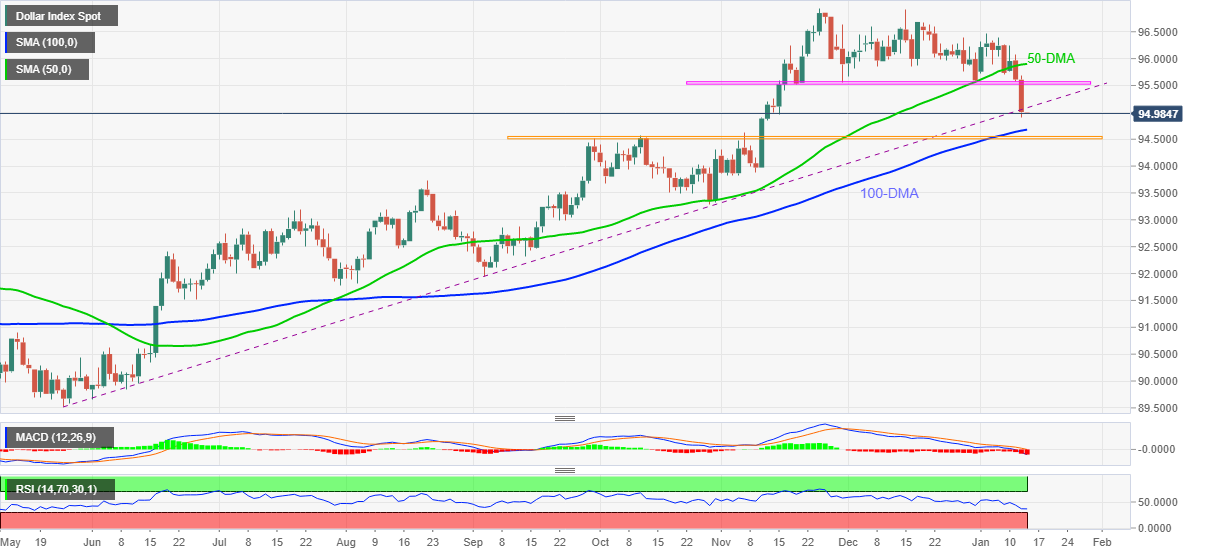
US Dollar Index (DXY) bears take a breather around multi-day low, making rounds to the 95.00 threshold during Thursday’s Asian session.
The greenback gauge dropped to the lowest levels since November 11 the previous day after breaking two-month-old horizontal support and an ascending trend line from May 25.
The downside break of the key supports join bearish MACD signals and an absence of oversold RSI conditions to favor DXY sellers.
That said, the 100-DMA level near 94.67 can act as immediate support for the US Dollar Index. Though, a horizontal area comprising September’s top near 94.50 becomes a tough nut to crack for the DXY bears.
In a case where the quote drops below 94.50, August month’s high of 93.72 will be in focus.
Meanwhile, the support-turned-resistance line from May, around 95.10, restricts the DXY’s corrective pullback.
Following that, the aforementioned horizontal support, now resistance around 95.55, will precede the 50-DMA level of 95.90 to limit the US Dollar Index advances.
To sum up, DXY is ready for further downside but the key support around 94.50 will be a test for bears.
DXY: Daily chart
Trend: Further weakness expected