WTI Price Analysis: Defends $69.00 around two-week low
- WTI remains pressured around fortnight low, extends Friday’s losses.
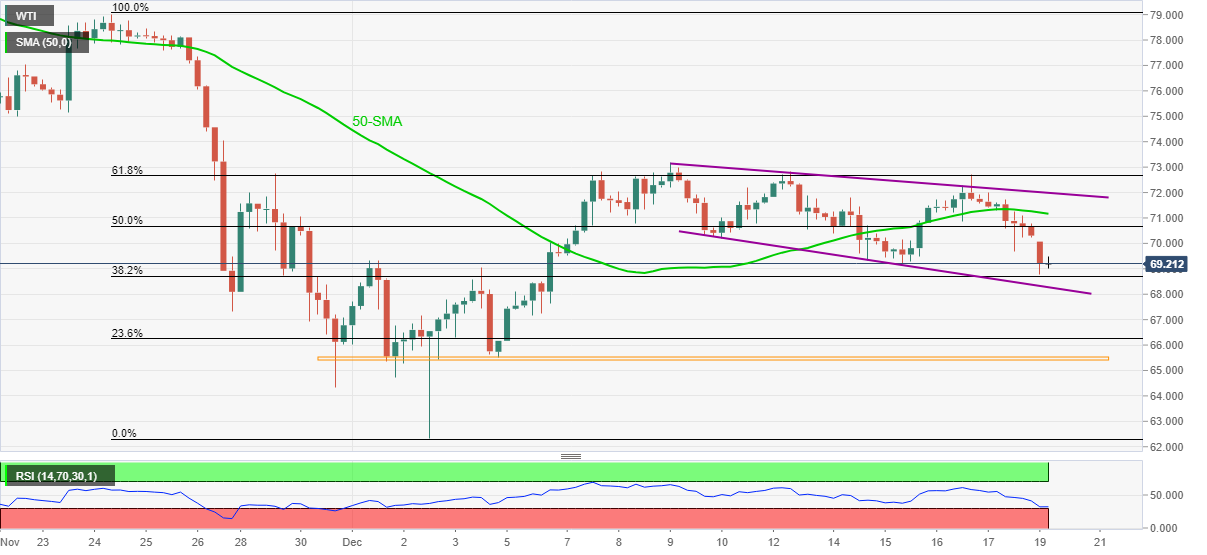
- 50-DMA guards corrective pullback inside Megaphone broadening pattern.
- Short-term support line tests immediate downside amid oversold RSI conditions.
WTI crude oil traders lick their wounds near $69.20, down 1.55% intraday after refreshing the two-week low during early Monday.
In doing so, the black gold trades inside a Megaphone chart formation while justifying failures to stay beyond the 50-SMA.
Even so, oversold RSI conditions may trigger the quote’s bounce from the support line of the state Megaphone, near $68.25.
Should the quote fail to recover from $68.25, it becomes vulnerable to test monthly horizontal support near $65.50.
Alternatively, recovery moves remain elusive below the 50-DMA level of $71.15, a break of which will direct WTI buyers to challenge the Megaphone’s upper line near $72.00.
During the commodity’s upside past $72.00, the 61.8% Fibonacci retracement level of November 24 to December 02 downside, near $72.70, will act as an additional upside filter before recalling the bulls.
WTI: Four-hour chart
Trend: Further weakness expected