GBP/JPY Price Analysis: Mildly bid around 150.00 inside weekly triangle
- GBP/JPY hovers around intraday high, eyes first weekly gains in three.
- Firmer RSI hints at further recovery, 200-HMA strength to the triangle’s resistance.
- Bears can aim for yearly low but further downside becomes tough.
GBP/JPY struggles to defend the weekly gains, taking rounds to 150.10 during early Friday.
The cross-currency pair remained pressured during the last three days while consolidating the strong gains marked on Monday. The resulting moves portray a weekly symmetrical triangle to restrict the pair prices.
That said, the firmer RSI conditions and a sustained bounce off triangle support hints at a further run-up towards the pattern’s upper line, near 150.30 by the press time.
Given the 200-HMA level of 150.35 adding strength to the pair’s short-term resistance, GBP/JPY upside past 150.35 becomes difficult, a break of which will quickly fuel the pair towards a descending resistance line from November 28, around 150.75 at the latest.
Should the GBP/JPY bulls keep reins past 150.75, odds of witnessing a rally towards November 19 swing low near 152.50 can’t be ruled out.
On the flip side, pullback moves remain elusive beyond the triangle’s support line of 149.60. Also acting as immediate support is the 150.00 threshold.
If at all the GBP/JPY bears break the stated triangle towards the south, the latest low around 149.00 and the yearly trough surrounding 148.50 should lure the bears.
Though, any further downside past 148.50 will be challenged by the likely RSI conditions and December 2019 high close to 147.90.
GBP/JPY: Four-hour chart
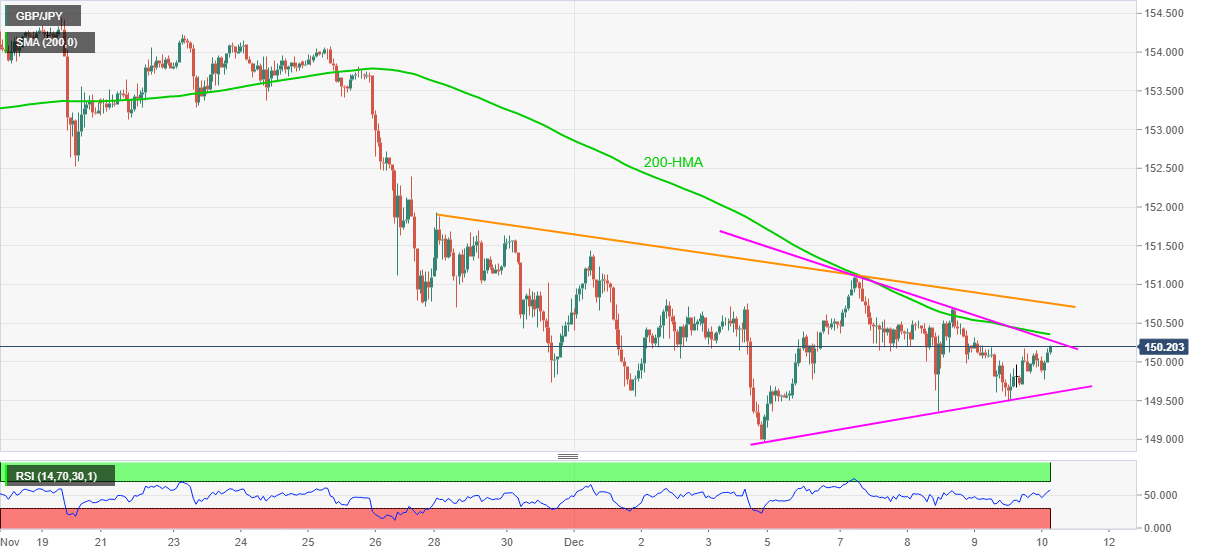
Trend: Sideways