EUR/JPY Price Analysis: Tweezers-top candle pattern exposes 129.00 and beyond
- EUR/JPY slides for the second day in a row amid mixed market sentiment.
- EUR/JPY: A break below the 200-day moving average could tumble the cross-currency.
- EUR/JPY: Tweezers-top candle pattern supports the bearish bias.
The EUR/JPY starts the Asian session on the wrong foot, edges lower, trading at 129.87, down 0.31% at the time of writing. As the Asian session begins, the market sentiment is a mixed bag, with most Asian equity indices futures rising between 0.01% and 0.53%, except for the Hang-Seng and the FTSE China A50 Index, which are dropping 0.19% and 0.22%, respectively.
The US 10-year benchmark note yield, which dramatically influences the Japanese Yen, is at 1.524%, unchanged.
EUR/JPY Price Forecast: Technical outlook
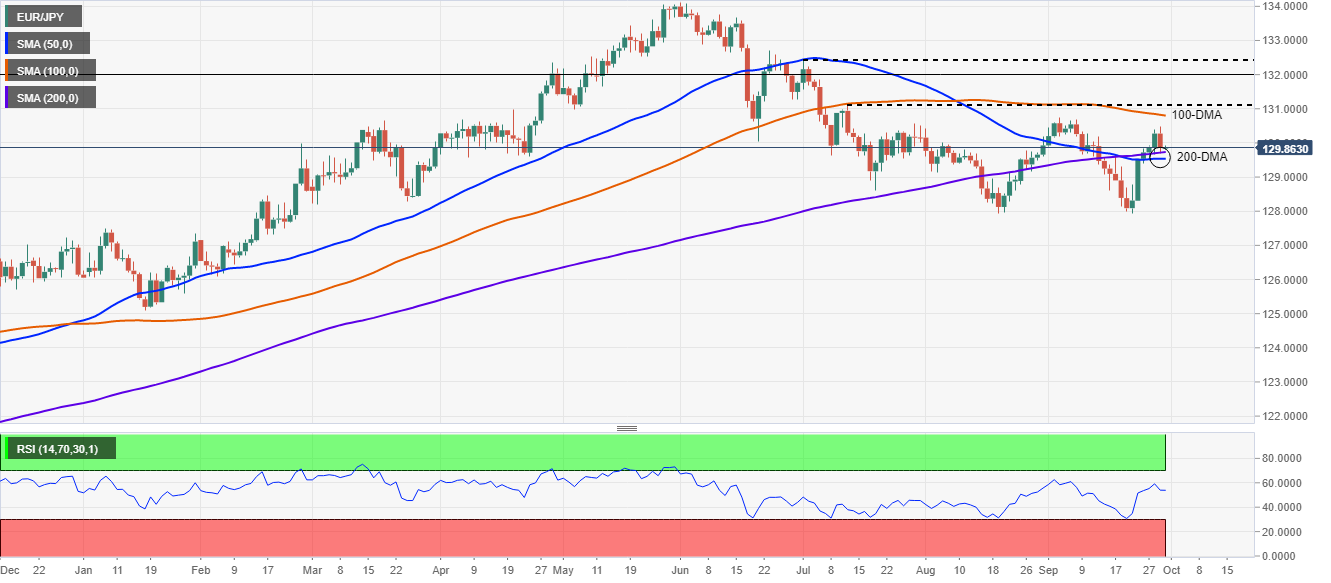
Daily chart.
EUR/JPY price action for the last couple of days depicts the formation of a tweezers-top candle pattern, which suggests that lower prices lie ahead. However, the September 29 low at 129.67 pierced the 200-day moving average (DMA), but it bounced off and closed around 129.86.
For the EUR/JPY sellers to resume the downtrend on the cross-currency, they will need a daily close below 129.50. In case of that outcome, the following support level would be the September 22 low at 127.93. A decisive daily break of the latter could expose the February 1 high at 127.15.
On the flip side, if the EUR/JPY buyers want to regain control, they need to reclaim 130.30. If the buyers break that level, then the next supply zone would be the confluence of the September 3 high and the 100-day moving average (DMA) around the 130.74-80 range.
The Relative Strength Index is at 53, slightly up, supporting the upside bias, but the tweezers-top candle pattern, and the closeness to the confluence of the 200 and the 50-DMA’s, could exert downward pressure to the EUR/JPY.
ADDITIONAL LEVELS TO WATCH