Gold Price Forecast: XAU/USD eyes $1730 and $1727 as next downside targets – Confluence Detector
- Gold price remains vulnerable as markets cheer Fed rate hike prospects.
- Treasury yields retreat but the upside momentum still remains intact.
- Gold remains vulnerable amid hawkish Fed outlook.
Gold is off the lows but remains vulnerable amid the underlying narrative the Fed could announce a sooner-than-expected rate hike, as the TIPS market has also started pricing in higher future inflation. The benchmark 10-year Treasury yields rallied to the highest levels in three-months at 1.55%, as Fed officials noted that they see tapering close. The US dollar has tagged higher alongside yields, exerting additional downward pressure on gold price.
Read: Gold Price Forecast: Focus remains on yields as XAU/USD eyes a pennant breakout
Gold Price: Key levels to watch
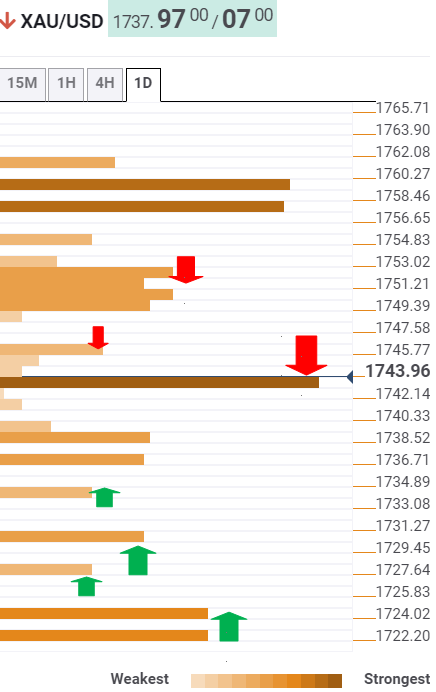
According to the Technical Confluences Detector, gold faced rejection at strong resistance around $1743, which is the confluence of the pivot point one-day S1 and Fibonacci 38.2% one-month.
If the abovementioned hurdle is cleared, then gold bulls will look to test the previous day low of $1745.
Further up, gold buyers will need a lot of conviction to take out a bunch of key resistance levels stacked up around $1750. At that level, the SMA10 four-hour, Fibonacci 38.2% one-day and Fibonacci 23.6% one-week coincide.
The next relevant upside target is seen at the Fibonacci 61.8% one-day at $1754.
On the flip side, immediate support awaits at $1734, the Bollinger Band one-day Lower.
If the selling pressure intensifies then a test of the pivot point one-week S1 at $1730 remains inevitable. Minor support at $1727, the pivot point one-day S3 will come into play.
Gold bulls will then look forward to temporary respite near $1724, where pivot point one-month S1 lies.
Here is how it looks on the tool
About Technical Confluences Detector
The TCD (Technical Confluences Detector) is a tool to locate and point out those price levels where there is a congestion of indicators, moving averages, Fibonacci levels, Pivot Points, etc. If you are a short-term trader, you will find entry points for counter-trend strategies and hunt a few points at a time. If you are a medium-to-long-term trader, this tool will allow you to know in advance the price levels where a medium-to-long-term trend may stop and rest, where to unwind positions, or where to increase your position size.