US Dollar Index Price Analysis: DXY bulls seem to be tired near 93.50 resistance
- DXY struggles to extend two-day uptrend near six-week-old horizontal hurdle.
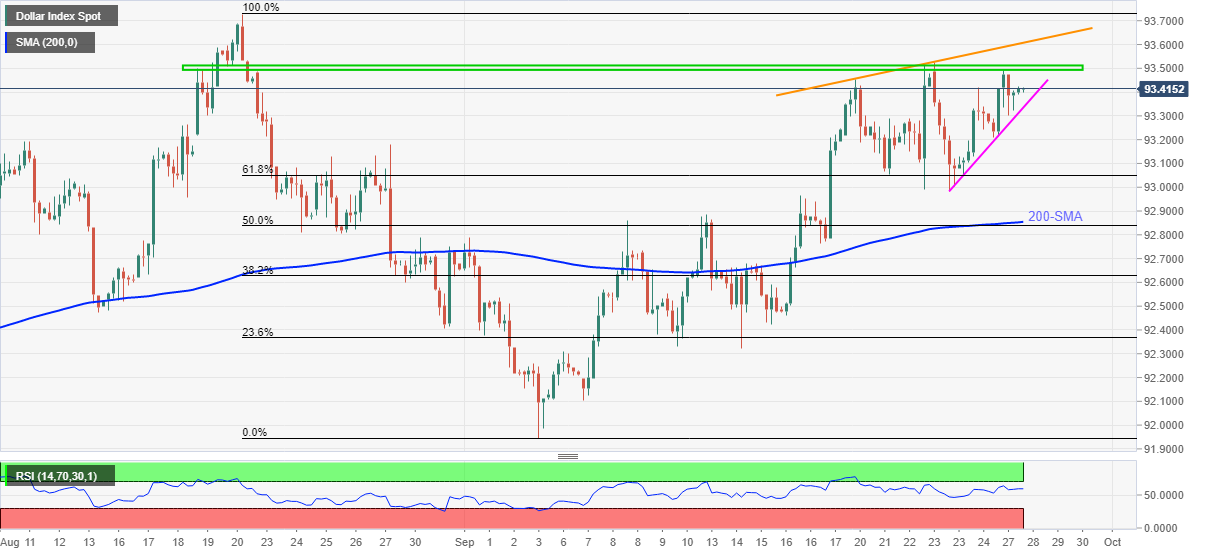
- Weekly resistance line, August high challenge buyers amid steady RSI.
- A convergence of 50% Fibonacci retracement, 200-SMA becomes the key support.
US Dollar Index (DXY) seesaws inside a 20-pip trading range above 93.30, recently edging higher around 93.45 amid Tuesday’s Asian session. In doing so, the greenback gauge dwindles after a two-day uptrend.
The reason could be linked to the steady RSI and a horizontal area established from August 18, near 93.50.
Also challenging the DXY bulls is a one-week-old rising trend line around 93.60, followed by August month’s high near 93.75.
In a case where the US Dollar Index rallies past 93.75, the November 2020 peak of 94.30 will be in focus.
Meanwhile, pullback moves will need to break a three-day-old support line near 93.30 to gain the market’s attention.
Following that, a confluence of 50% Fibonacci retracement of late August to early September fall and 200-SMA, near 92.85, will be crucial to watch.
DXY: Four-hour chart
Trend: Pullback expected