31 Aug 2021
US Dollar Index Price Analysis: The loss of 92.50 could expose 91.80
- DXY remains under pressure in the mid-92.00s.
- The loss of lows near 92.80 should expose further decline.
DXY accelerates losses and re-tests the key support area around 92.50 on turnaround Tuesday.
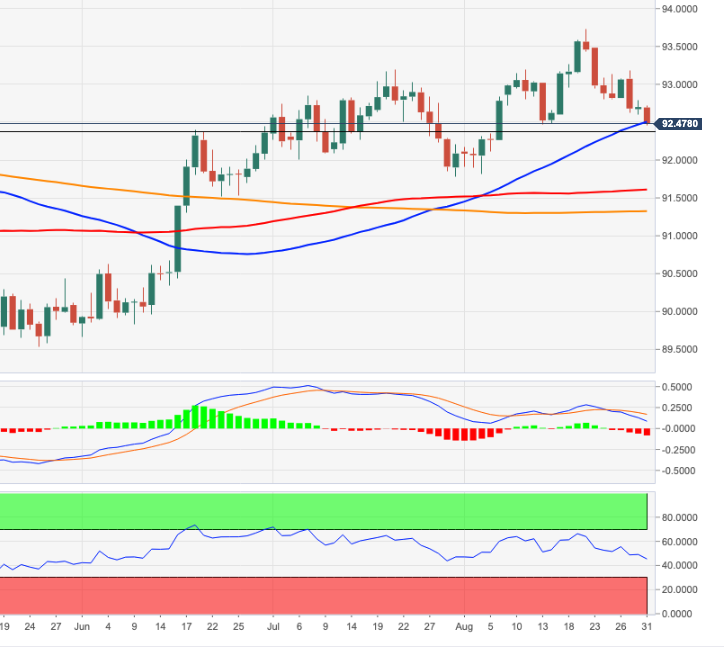
The index puts the contention region near 92.50 to the test so far, this area is also reinforced by the 55-day SMA at 92.49.
The loss of this contention region carries the potential to allow for further retracements in the short-term horizon. That said, there are no relevant support levels until the July low at 91.78 (July 30).
In the meantime, and looking at the broader scenario, the positive stance on the dollar is expected to remain unchanged as long as the index trades above the 200-day SMA, today at 91.32.
DXY daily chart