AUD/NZD Price Analysis: Remains pressured around 16-month low
- AUD/NZD bears take a breather after refreshing multi-day bottom.
- A daily closing below 61.8% Fibonacci retracement becomes necessary for further selling.
- Oversold RSI hints at a corrective pullback towards seven-week-old resistance line.
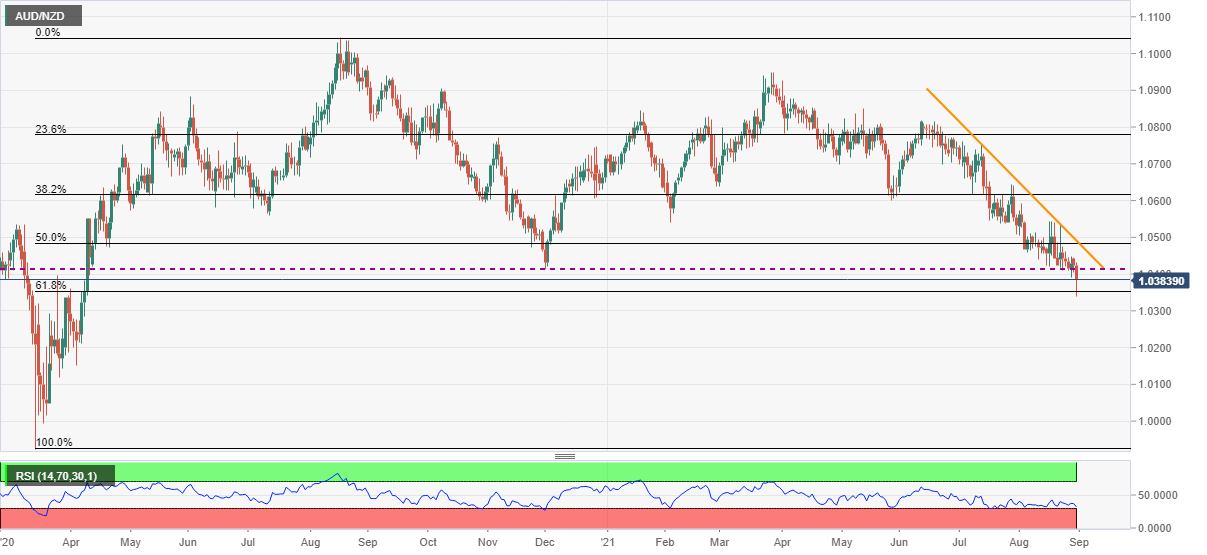
AUD/NZD bears smashed 61.8% Fibonacci retracement of March-August 2020 upside to test the lowest levels since April 2020 around 1.0340 during early Tuesday. That said, the cross-currency pair wobbles around 1.0383, down 0.40% intraday by the press time.
Given the heavy fall, a corrective pullback, supported by the oversold RSI can’t be ruled out. However, AUD/NZD buyers won’t be serious until witnessing a daily closing past a downward sloping trend line from mid-July, around 1.0490.
It should be noted that the late 2020 bottom surrounding 1.0410 offers immediate resistance to the pair.
On the contrary, 61.8% Fibonacci retracement level of 1.0352 holds the key to the AUD/NZD pair’s further weakness.
Following that, April 2020 lows near 1.0150 can lure the pair sellers ahead of directing them to the 1.0000 psychological magnet and the previous yearly low close to 0.9925.
AUD/NZD: daily chart
Trend: Corrective pullback expected