AUD/USD Price Analysis: Bulls flirt with 200-hour SMA, around mid-0.7200s
- AUD/USD gained strong follow-through traction on Tuesday amid the ongoing USD pullback.
- Mixed technical indicators on hourly/daily charts warrant some caution for aggressive bulls.
The AUD/USD pair built on the previous day's goodish recovery move from YTD lows, around the 0.7100 mark and gained traction for the second consecutive session on Tuesday. The momentum pushed the major to mid-0.7200s, or multi-day tops during the mid-European session and was sponsored by a combination of factors.
The US dollar was weighed down by expectations that the Fed would wait for a longer period before rolling back its pandemic-era stimulus amid the worsening COVID-19 situation in the US. Apart from this, the risk-on impulse further undermined the safe-haven greenback and benefitted the perceived riskier aussie.
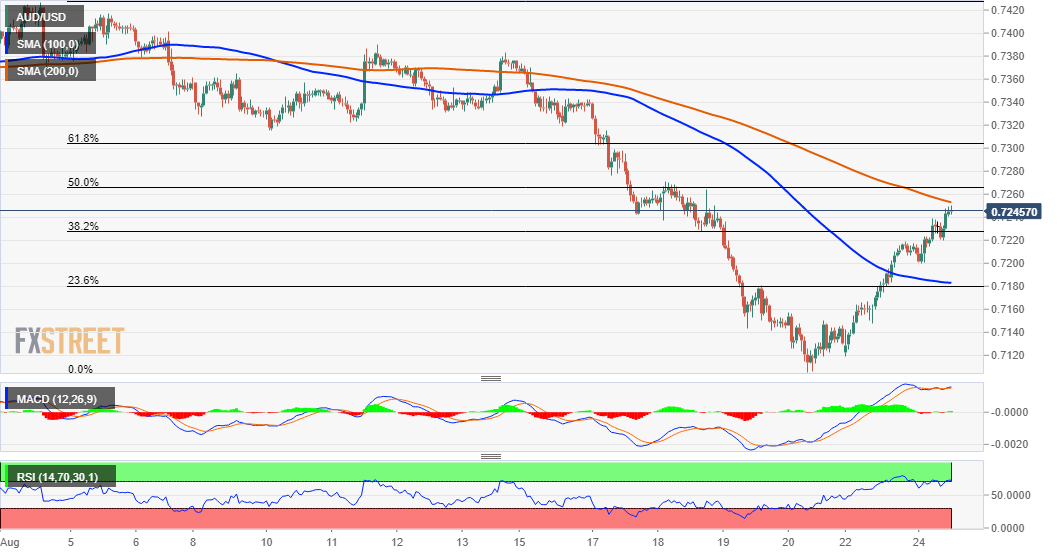
From a technical perspective, a sustained move beyond the 38.2% Fibonacci level of the 0.7427-0.7106 downfall was seen as a key trigger for intraday bullish traders. The AUD/USD pair was last seen trading near the 200-hour SMA resistance, which if cleared will set the stage for a further appreciating move.
Meanwhile, technical indicators on the 4-hour chart have been gaining positive traction and add credence to the constructive outlook. That said, RSI on the 1-hour chart is already flashing slightly overbought conditions. Moreover, oscillators on the daily chart are still holding in the bearish territory, warranting caution.
This makes it prudent to wait for some strong follow-through buying beyond the 50% Fibo. level, around the 0.7260 region, before confirming that the AUD/USD pair has bottomed out in the near term. The subsequent positive move has the potential to lift the pair back towards the 0.7300 mark, or the 61.8% Fibo. level.
On the flip side, the 38.2% Fibo. level, around the 0.7225-20 region, now seems to protect the immediate downside ahead of the 0.7200 round figure. Any further decline could attract some buying near the 0.7280-75 confluence, comprising of the 23.6% Fibo. level and 100-hour SMA, which should act as a pivotal point for traders.
AUD/USD 1-hour chart
Technical levels to watch