Gold Price Forecast: XAU/USD remains focused on $1767 upside target – Confluence Detector
- Gold off daily highs but the bullish potential remains intact.
- Weaker Treasury yields, DXY offer support to gold price.
- Gold has room to rise towards $1765-$1770, US Consumer Sentiment awaited.
Gold price is easing back towards $1750, having refreshed four-day highs at $1760 in the last hours. Despite the minor pullback, the bullish potential in gold price remains intact amid the ongoing weakness in the Treasury yields, which remains a drag on the US dollar. The returns on the market sag, as investors turn cautious amid the continued spread of the Delta covid variant cases and uncertainty over the Fed’s next monetary policy move. Softer US CPI and upbeat PPI data have left the markets in limbo, given the recent expectations about the Fed’s tapering. Looking ahead, the US Preliminary UoM Consumer Sentiment could provide fresh hints on the economy, impacting the USD valuations, in turn, gold.
Read: US Consumer Sentiment Preview: Payrolls, inflation and the pandemic
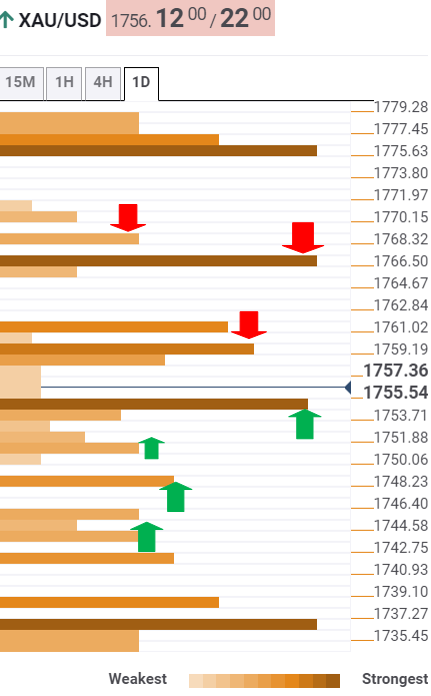
Gold Price: Key levels to watch
The Technical Confluences Detector shows that gold tested the powerful resistance at $1760, which is the convergence of the previous week’s low and Bollinger Band one-hour Upper.
Acceptance above the latter is needed to take on the immediate resistance at $1762, the pivot point one-day R1.
The next significant upside target is envisioned at $1767, the previous month’s low, around where the pivot point one-day R2 coincides.
Alternatively, bears need to find a strong foothold below the fierce support at $1754, the confluence of the Fibonacci 23.6% one-day, SMA5 four-hour and the previous low four-hour.
Sellers will then aim for the $1750 support area, where the Fibonacci 38.2% one-day meets the SMA50 one-hour.
Further south, the intersection of the Fibonacci 61.8% one-day and Bollinger Band one-hour Lower at $1748 guards the downside.
A dense cluster of support levels around $1744 could then test the bearish commitments.
Here is how it looks on the tool
About Technical Confluences Detector
The TCD (Technical Confluences Detector) is a tool to locate and point out those price levels where there is a congestion of indicators, moving averages, Fibonacci levels, Pivot Points, etc. If you are a short-term trader, you will find entry points for counter-trend strategies and hunt a few points at a time. If you are a medium-to-long-term trader, this tool will allow you to know in advance the price levels where a medium-to-long-term trend may stop and rest, where to unwind positions, or where to increase your position size.