GBP/USD Price Analysis: Eases from short-term falling wedge resistance below 1.3900
- GBP/USD refreshes intraday low while extending pullback from resistance line of a bullish chart pattern.
- 200-bar SMA offers immediate support amid bullish MACD.
- Weekly support line, wedge support add to the downside filters.
- Upside break of the immediate hurdle will eye February top.
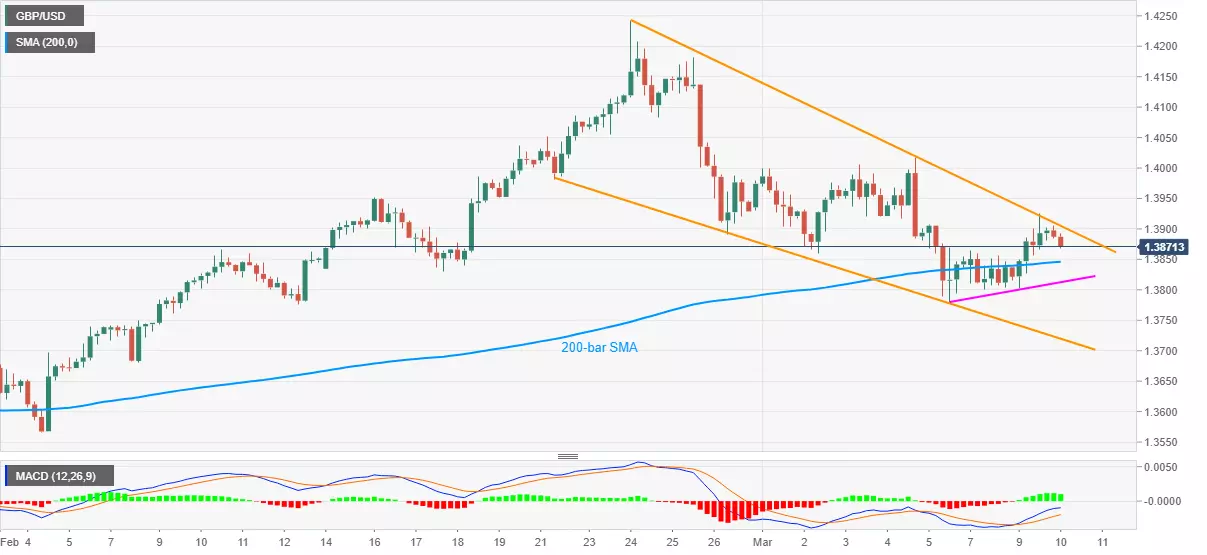
GBP/USD drops to the intraday low of 1.3868, currently down 0.15% around 1.3865, amid early Wednesday. In doing so, the cable steps back from the upper line of a bullish chart pattern.
Although pullback moves eye 200-bar SMA level of 1.3846, bullish MACD can test the pair’s further weakness, if not then one-week-old support line at 1.3812 now, should challenge the GBP/USD sellers.
If at all the sterling bears dominate past-1.3812, the 1.3800 threshold and the lower line of falling wedge pattern established since late February, presently around 1.3720, will be the key to watch.
Alternatively, an upside break of the stated resistance line, at 1.3905 now, will trigger a run-up towards February’s multi-month high of 1.4243.
During the rise, the 1.4000 psychological magnet and the monthly top around 1.4020 may act as intermediate halts.
GBP/USD four-hour chart
Trend: Pullback expected