NZD/USD Price Analysis: Fades bounces off two-month-old support-line, 50-day SMA
- NZD/USD fizzles late Wednesday’s corrective pullback while easing from 21-day SMA.
- 50-day SMA, ascending trend line from December 21 restrict immediate downside.
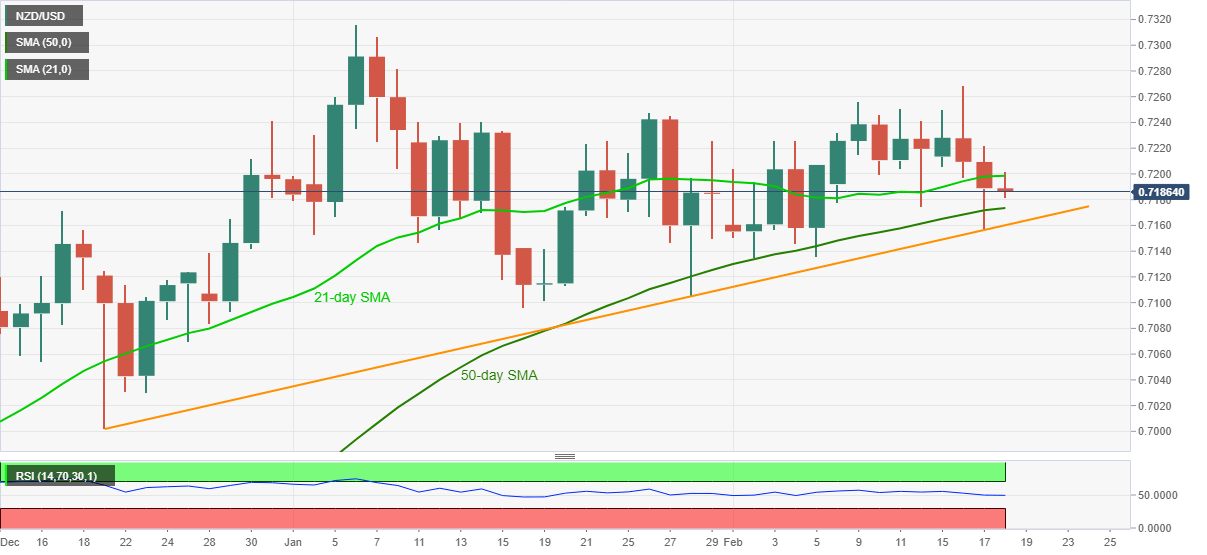
NZD/USD reverses the early Asian recovery moves while declining back below the sub-0.7200 area, currently down to 0.7188, during the early Thursday’s trading. The kiwi pair dropped to the lowest in two weeks but failed to a two-month-old support line, needless to mention about 50-day SMA.
However, the following bounce couldn’t rise past-21-day SMA and hence suggest the quote’s underlying weakness that eyes 50-day SMA level of 0.7173 as immediate rest ahead of direct NZD/USD bears to the stated support line near 0.7160.
In a case where the downturn breaks 0.7160 support, the yearly bottom surrounding 0.7095 becomes the key to watch.
On the flip side, a daily closing beyond the 21-day SMA level of 0.7198 will trigger fresh upside moves targeting late January highs near 0.7250.
Though, the monthly peak surrounding 0.7270 and the previous month’s top, close to 0.7315, will be tough nuts to break for the NZD/USD bulls afterward.
Hence, NZD/USD is likely to remain depressed below 0.7250 but the downside has a bumpy road ahead.
NZD/USD daily chart
Trend: Bearish