28 Jan 2021
US Dollar Index Price Analysis: Rising bets for a move above 91.00
- DXY adds to the uptrend and trades closer to 91.00.
- The 2020-2021 resistance line also sits near 91.00.
DXY picks up extra pace and approaches the key hurdle in the 91.00 neighbourhood in the second half of the week.
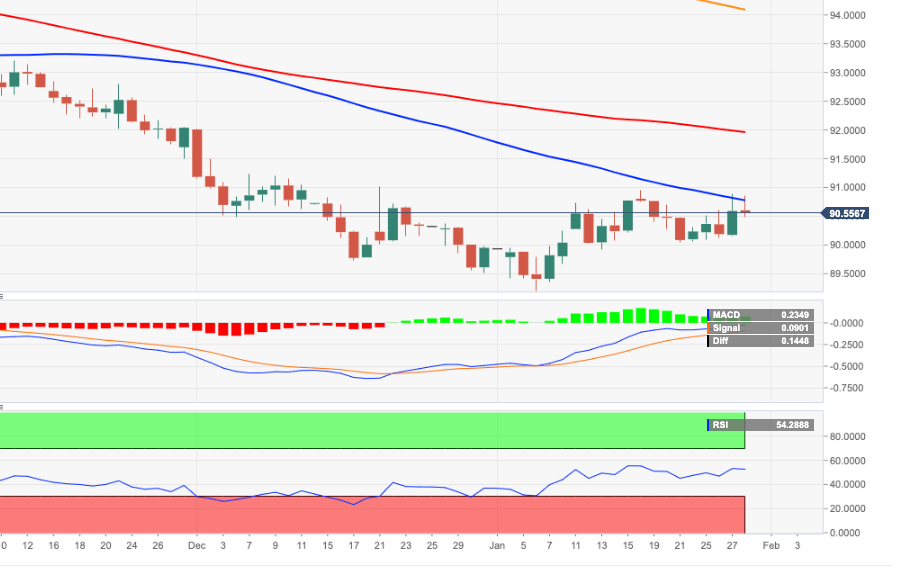
The 91.00 area emerges as the immediate target of significance. In this area coincides weekly tops (December 21), the so far 2021 high (January 18) and the 2021 resistance line. The 55-day SMA, today ay 90.78, reinforces this resistance. Above this region, the selling pressure is forecast to mitigate somewhat.
The ongoing rebound is seen as corrective only and in the longer run, as long as DXY trades below the 200-day SMA, today at 94.08, the negative view is expected to persist.
DXY daily chart