USD/INR Price News: Indian rupee buyers defy Thursday’s doji to follow 50-day SMA resistance
- USD/INR remains on the back foot below 74.00.
- Bearish MACD, sustained trading below the key SMA favor sellers.
- Two-week-old falling trend line adds a filter to the north, 61.8% of Fibonacci retracement lures the bears.
USD/INR takes offers around 73.76, down 0.07% intraday, during the initial hours of Friday’s Indian trading. The rupee pair formed a bullish candlestick formation the previous day but couldn’t cross 50-day SMA on a daily closing.
The same took clues from bearish MACD to trigger fresh downside attacking the weekly low of 73.75 while also eyeing the 61.8% Fibonacci retracement of September-November upside, at 73.60.
It should, however, be noted that multiple supports around 73.50 and 73.30 challenge the USD/INR sellers past-73.60, if not then a three-month-old support line near 73.20 will gain the market’s attention.
In a case where the pair crosses 50-day SMA resistance, currently around 73.85, a descending trend line from November 13, at 74.07 now, will be the key to watch.
USD/INR daily chart
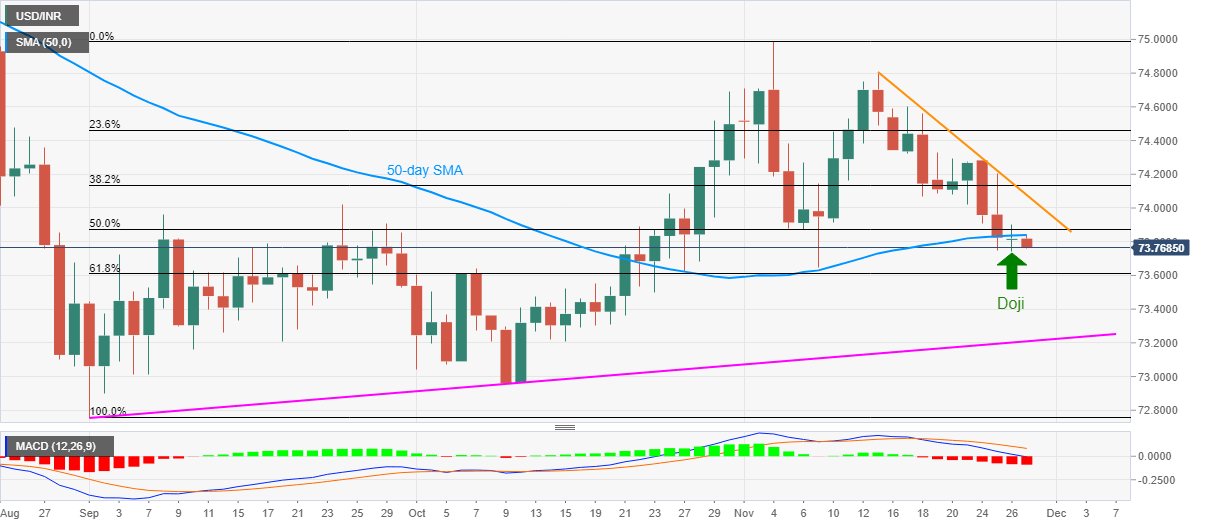
Trend: Bearish