28 Sep 2020
NZD/USD Price Analysis: Runs into 5-day SMA hurdle, bias remains bearish
- NZD/USD prints gain to test key SMA hurdle.
- Daily chart shows a double top bearish reversal pattern.
NZD/USD is pushing against the 5-day simple moving average (SMA) hurdle at 0.6564, having picked up a bid 0.6541 early Monday.
The uptick could be associated with the gains in the US stock index futures and the dollar's broad-based moderate losses.
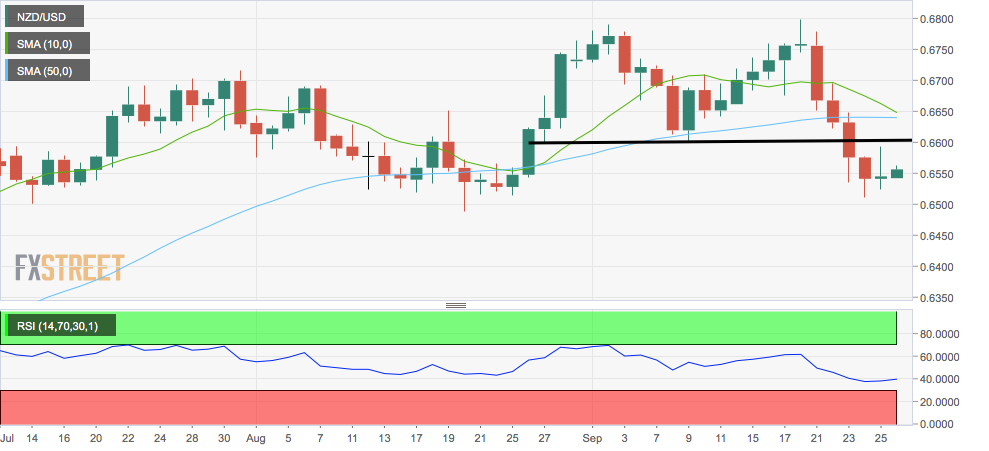
However, the bias remains bearish, with the pair trading well below 0.6601 – the double top neckline breached to the downside on Sept. 23.
Also, the 14-day relative strength index continues to report bearish conditions with a below-50 print. The 10-day and 50-day simple moving averages (SMAs) are about to produce a bearish crossover.
The support is located at 0.6507 (100-day SMA) and 0.6489 (Aug. 20 low), and resistances are seen at 0.6601 and 0.6638 (50-day SMA).
Daily chart
Trend: Bearish
Technical levels