WTI Price Analysis: Eyes $40 mark amid bullish crossover, ahead of EIA
- WTI breaks higher amid favorable technical set up on hourly chart.
- US oil heads towards $40 mark despite overbought RSI.
- 21-HMA cuts the 200-HMA from below, points to more gains.
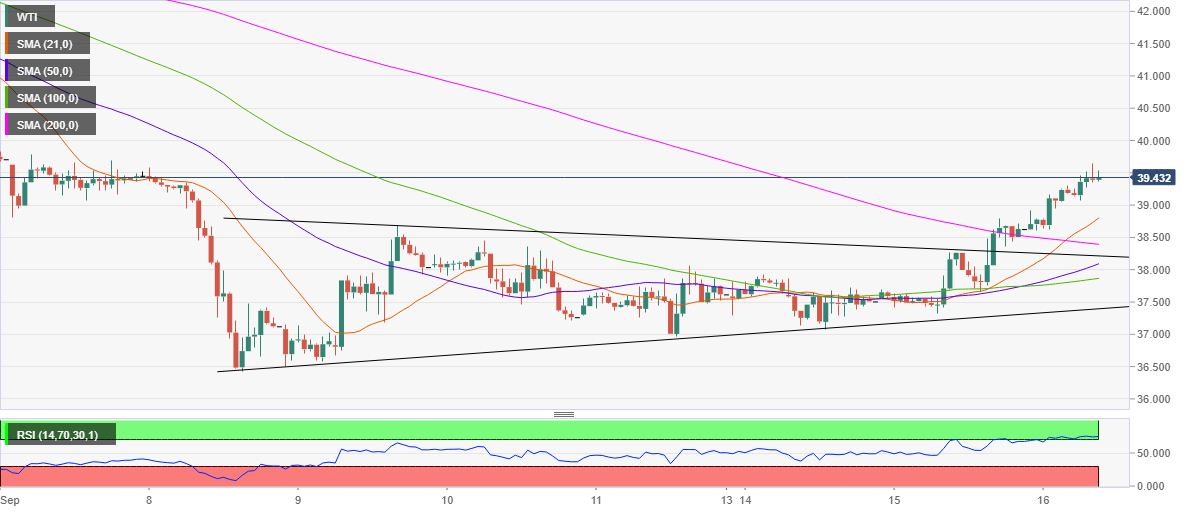
WTI (futures on Nymex) extends its steady rise into the European trading this Wednesday, as the bulls gear up for a test of the $40 mark.
However, a temporary pullback towards the 21-hourly Simple Moving Average (HMA) at $38.80 cannot be ruled out in the coming hours, as the hourly Relative Strength Index (RSI) trends in the overbought territory at 74.05.
A break below the latter could see a test of the bearish 200-HMA at $38.39.
Overall, the path of least resistance appears to the upside after the price charted a symmetrical triangle breakout on the hourly chart in the US last session.
With the further upside bolstered by the bullish crossover of the 50-HMA above the horizontal 100-HMA in early Asia. The latest leg higher witnessed follow-through buying interest, allowing for more gains, as the 21-HMA pierced through the downward-sloping 200-HMA from below.
The pattern target is marked at $40.53. Ahead of that level, the psychological 40 barrier will challenge the bulls’ commitment.
WTI: Hourly chart
WTI: Additional levels