EUR/USD Price Analysis: 1.19 again proves a tough nut to crack
- EUR/USD failed to print a close above 1.19 on Thursday.
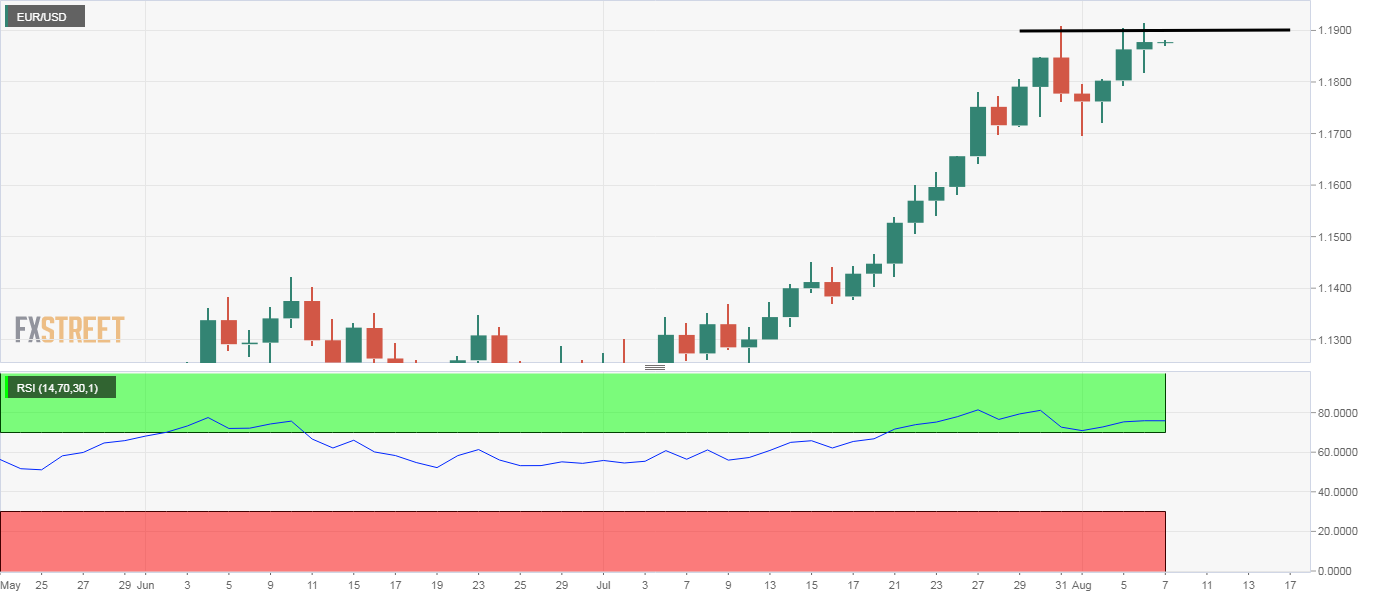
- Daily chart candlesticks and RSI signal bull exhaustion.
The EUR/USD pair has failed three times in the last five days to close above 1.19.
On Thursday, the currency pair clocked a high of 1.1916 but settled at 1.1876. Similar price action was observed on Wednesday and last Friday.
The repeated rejection above 1.19 validates the overbought reading on the 14-day relative strength index and suggests the ebbing of bullish momentum. A similar message is being echoed by Thursday’s spinning top candle – the one with long wicks and a small body.
As such, the pair could chart a notable pullback in the short-term. Key support is located at 1.1696 (Aug. 3 low), which if breached, would invalidate a higher lows setup on the daily chart and yield a decline to 1.1422 (June 10 high).
A close above 1.19 is needed to restore the bullish view.
Daily chart
Trend: Bearish