24 Apr 2020
USD/JPY Price Analysis: Greenback going nowhere vs. Japanese yen, trades sub-108.00 figure
- USD/JPY is ending the week pretty much where it started.
- The level to beat for bears is the 107.00 support.
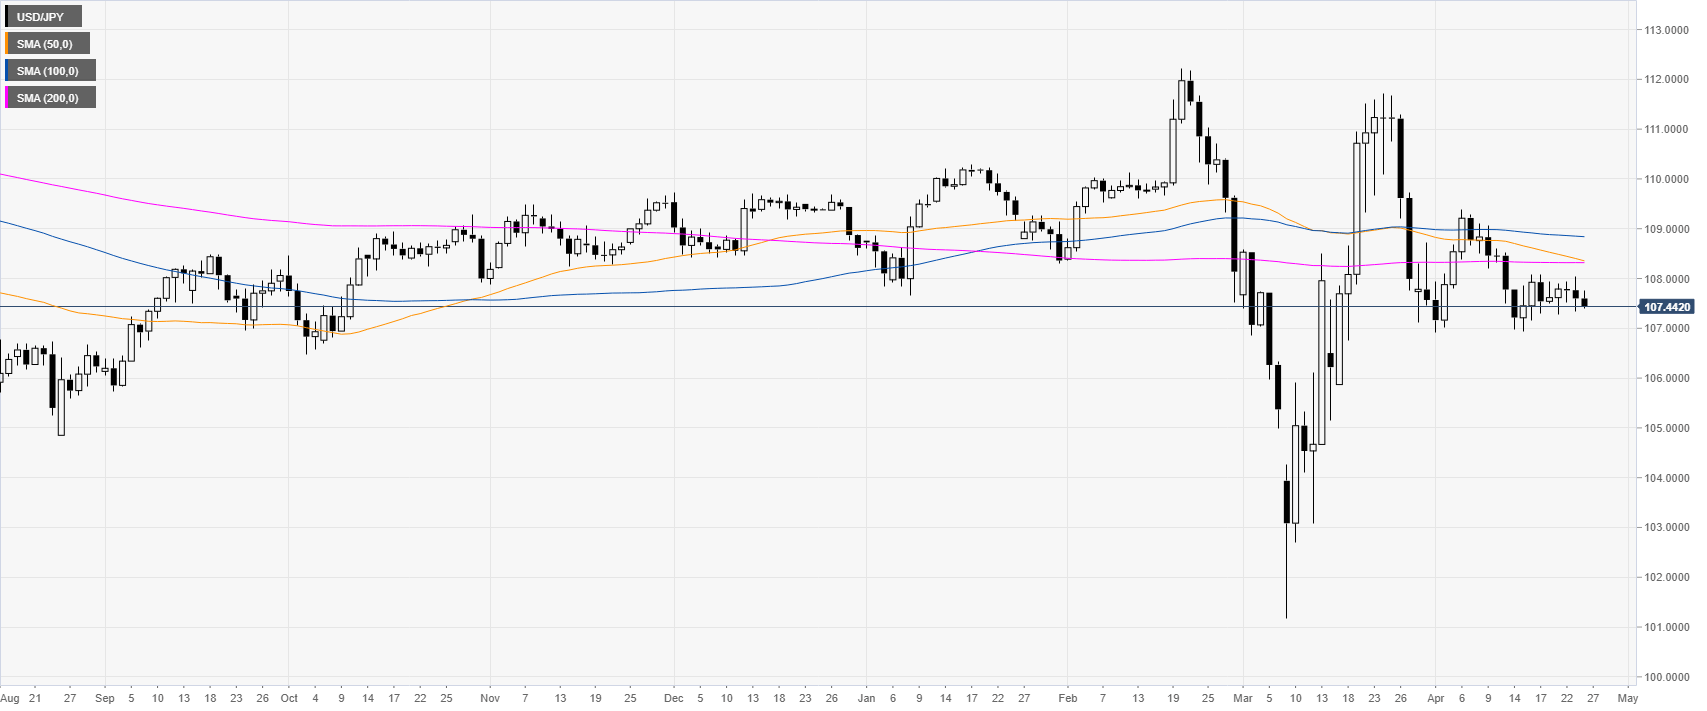
USD/JPY daily chart
USD/JPY keeps trading in a tight range below the 108.00 figure and the main SMAs on the daily chart as market participants are looking for a clear direction.
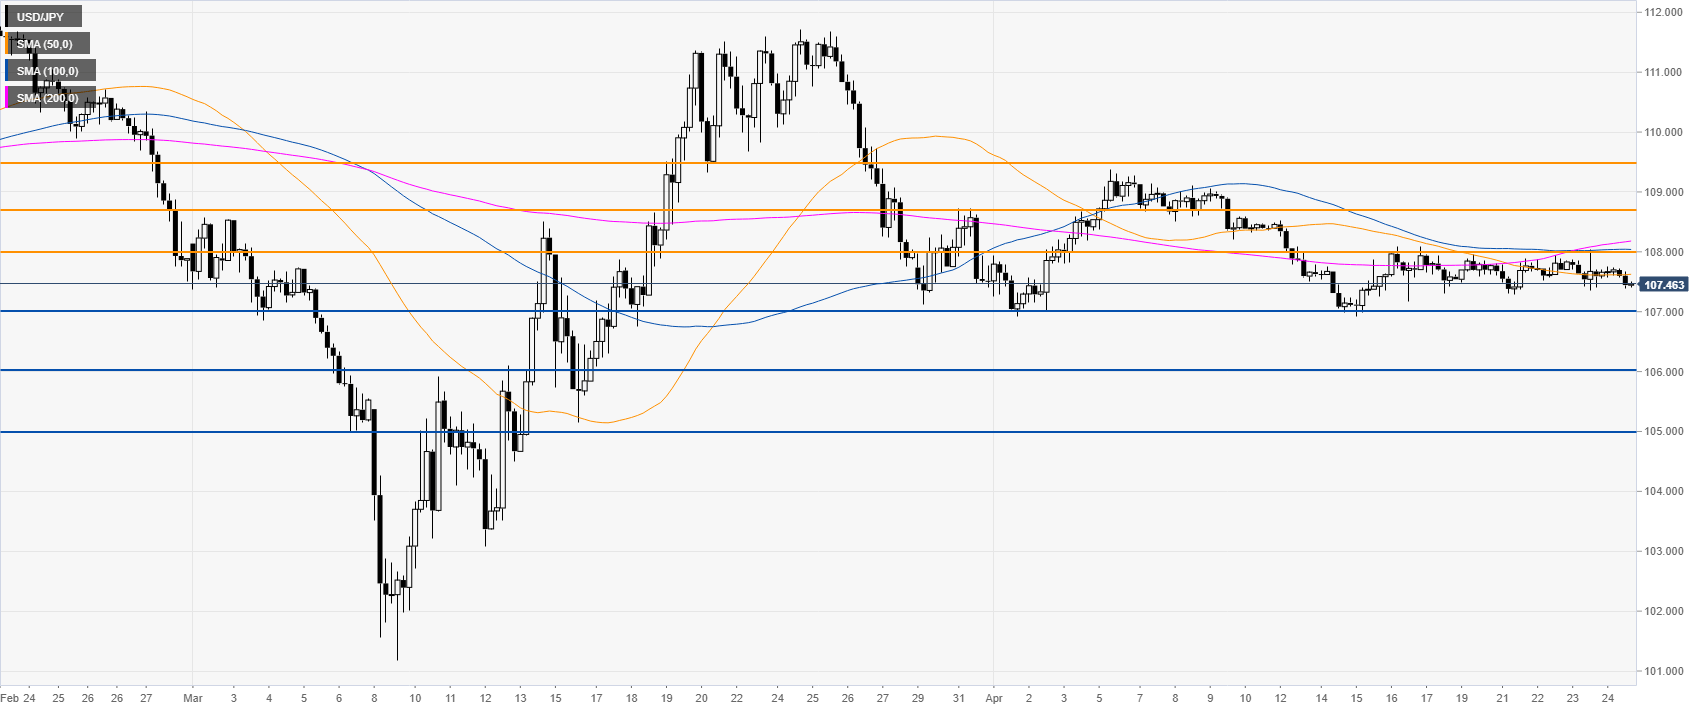
USD/JPY four-hour chart
USD/JPY is trading below the main SMAs on the four-hour chart suggesting a negative bias in the medium term. However, the spot remains confined in an extremely tight range. Sellers would need a clear daily close below the 107.00 figure, near the April low. On the flip side, resistance is seen near the 108.00 figure and a close above this level can lead to further gains.
Additional key levels