USD/CHF technical analysis: Bearish MACD questions upside beyond 21/200-day EMA
- USD/CHF trades near the weekly top following a sustained break of the key resistance confluence.
- 50% Fibonacci retracement, multiple resistance lines on the buyers’ radar.
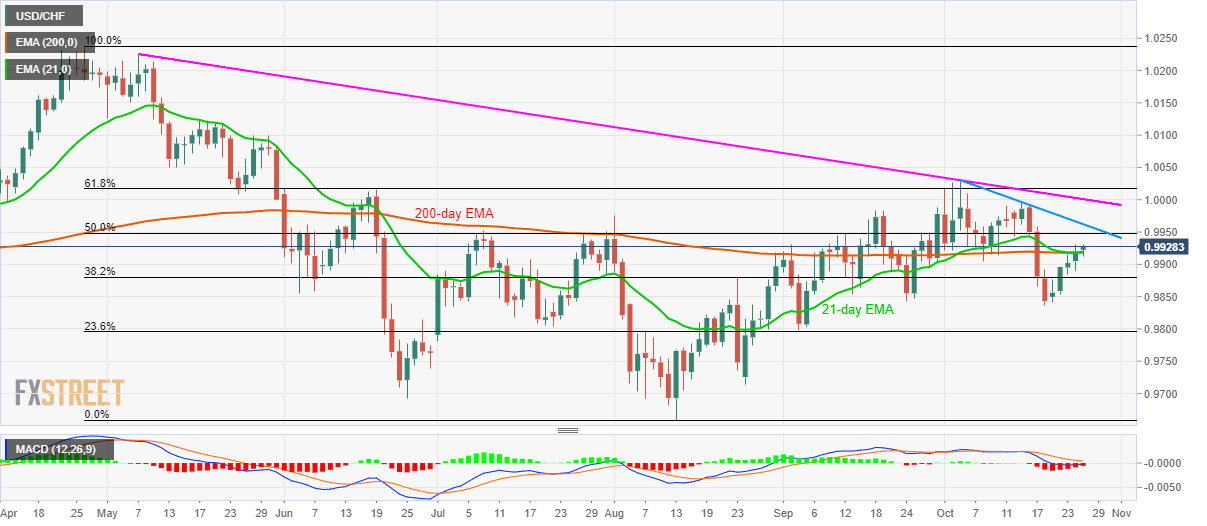
On early Friday, the USD/CHF pair trades successfully above 21 and 200-day Exponential Moving Average (EMA) confluence while taking the bids to 0.9925.
However, the bearish signal from 12-bar Moving Average Convergence and Divergence (MACD) raises doubts over the pair’s further upside. If not, 50% Fibonacci retracement level of April-August declines, at 0.9950, followed by three-week-old falling trend line, at 0.9965, could keep buyers in check.
Should there be a price rally beyond 0.9965, a downward sloping resistance line since early May month, at 1.0000 round-figure, will be in the spotlight.
Alternatively, pair’s daily closing below 0.9920/15 support-confluence seems to recall 38.2% Fibonacci retracement of 0.9880 and the monthly bottom close to 0.9835.
USD/CHF daily chart
Trend: Recovery likely to stall