13 Sep 2019
EUR/USD technical analysis: Euro ends the week below 1.1107 key resistance
- EUR/USD consolidated from daily highs but the bulls still threaten to break above the 1.1107 key resistance.
- Earlier, the Retail Sales Control Group matched expectations at 0.3%, helping EUR/USD easing from daily highs.
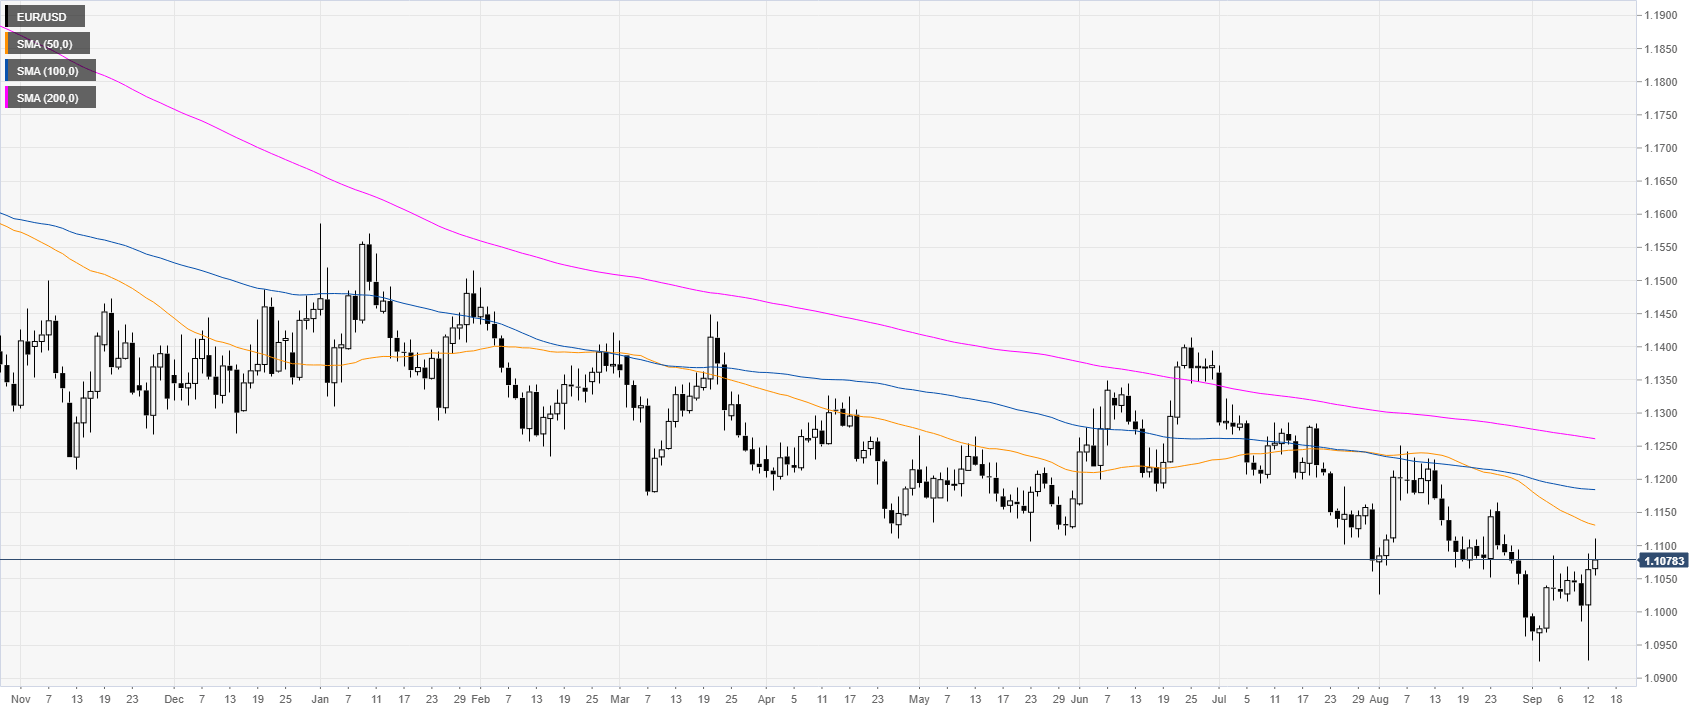
EUR/USD daily chart
On the daily time-frame, the shared currency is trading in a bear trend below the main daily simple moving averages (DSMAs). On Thursday, the European Central Bank’s (ECB) slashed rates by 0.1% and announced an open-ended Quantitive Easing (QE). However, after a bearish reaction, the market thought that the ECB was not dovish enough and the EUR rose sharply. This Friday, the Retail Sales Control Group in the United States (US) matched expectations at 0.3% in August.
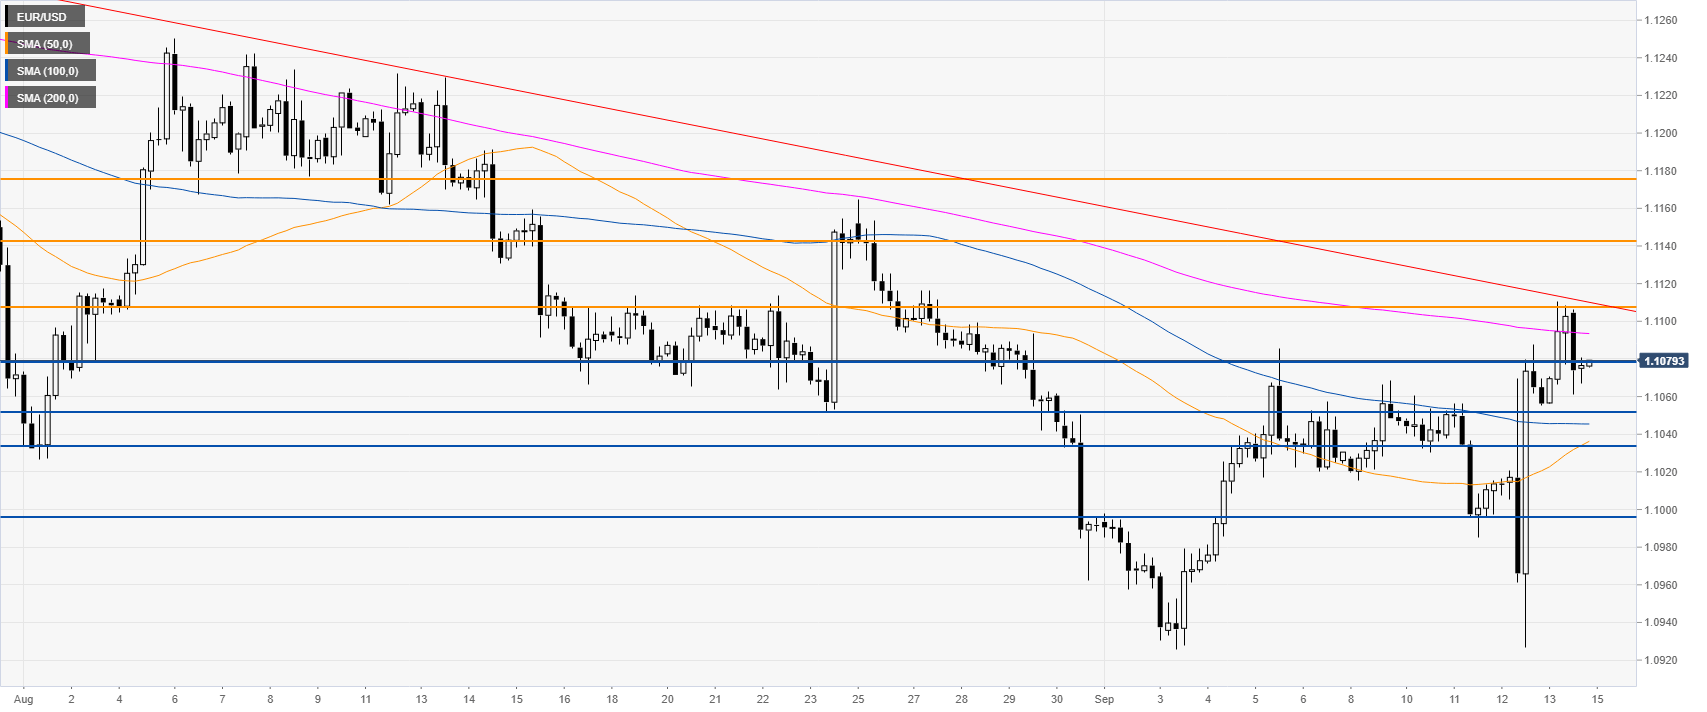
EUR/USD four-hour chart
The Fiber is consolidating in a critical resistance zone with of a multi-week descending trendline, the 200 SMA, and the 1.1107 resistance level. Buyers will have to overcome this cluster of resistance if they want to lift the market towards 1.1142 and 1.1176 resistances, according to the Technical Confluences Indicator.
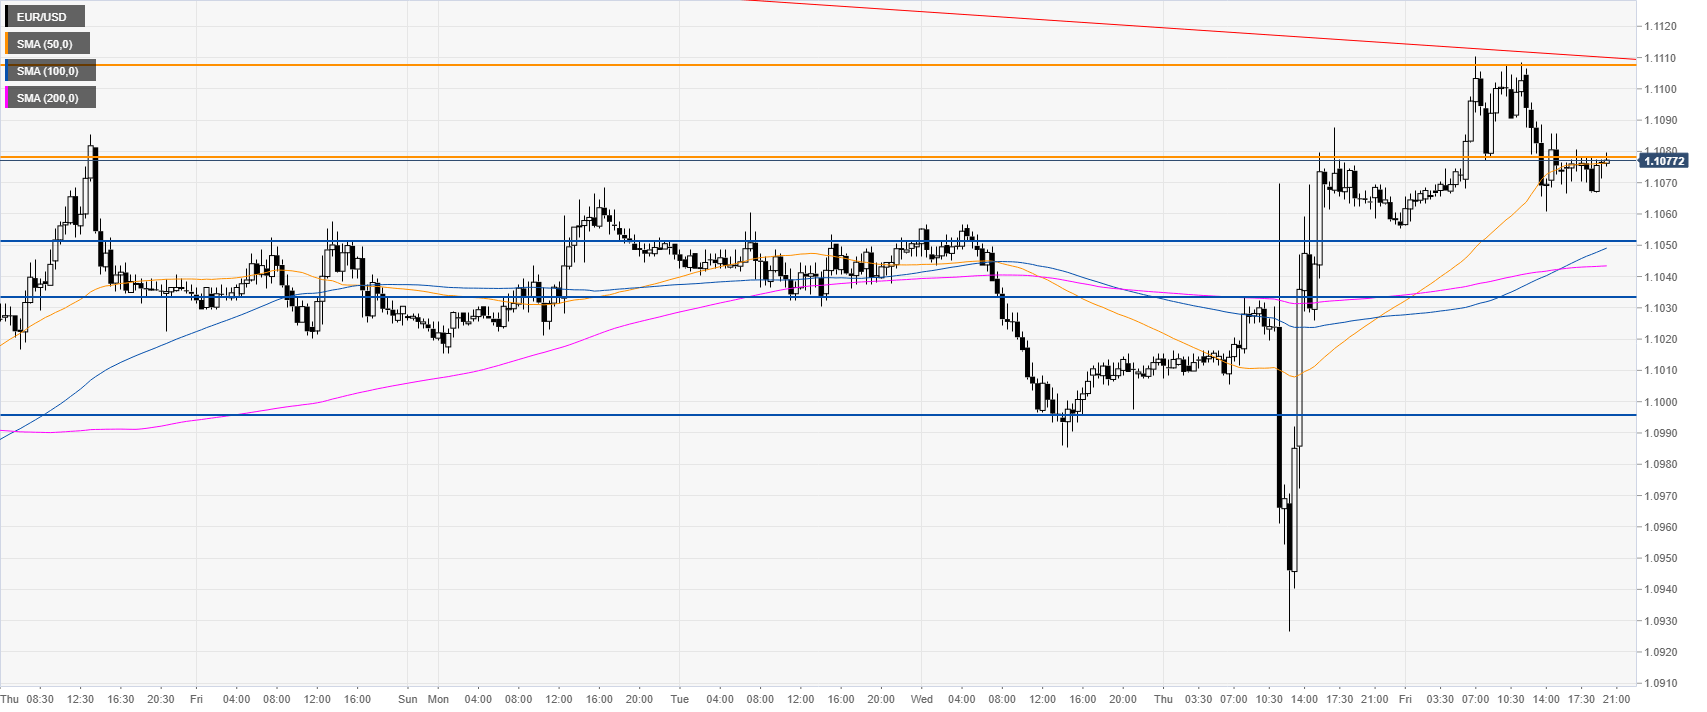
EUR/USD 30-minute chart
The market is challenging the 1.1079 resistance and the 50 SMA. It will be interesting to see if the bears resume the bear trend and bring the market down towards 1.1050, 1.1033 and 1.0992 or if the bulls will break above 1.1107 key resistance.
Additional key levels