19 Aug 2019
EUR/USD technical analysis: Fiber prints fresh daily lows below the 1.1066 level
- EUR/USD is softer in the second part of the New York session.
- The levels to beat for bears are the 1.1066 and 1.1044 levels.
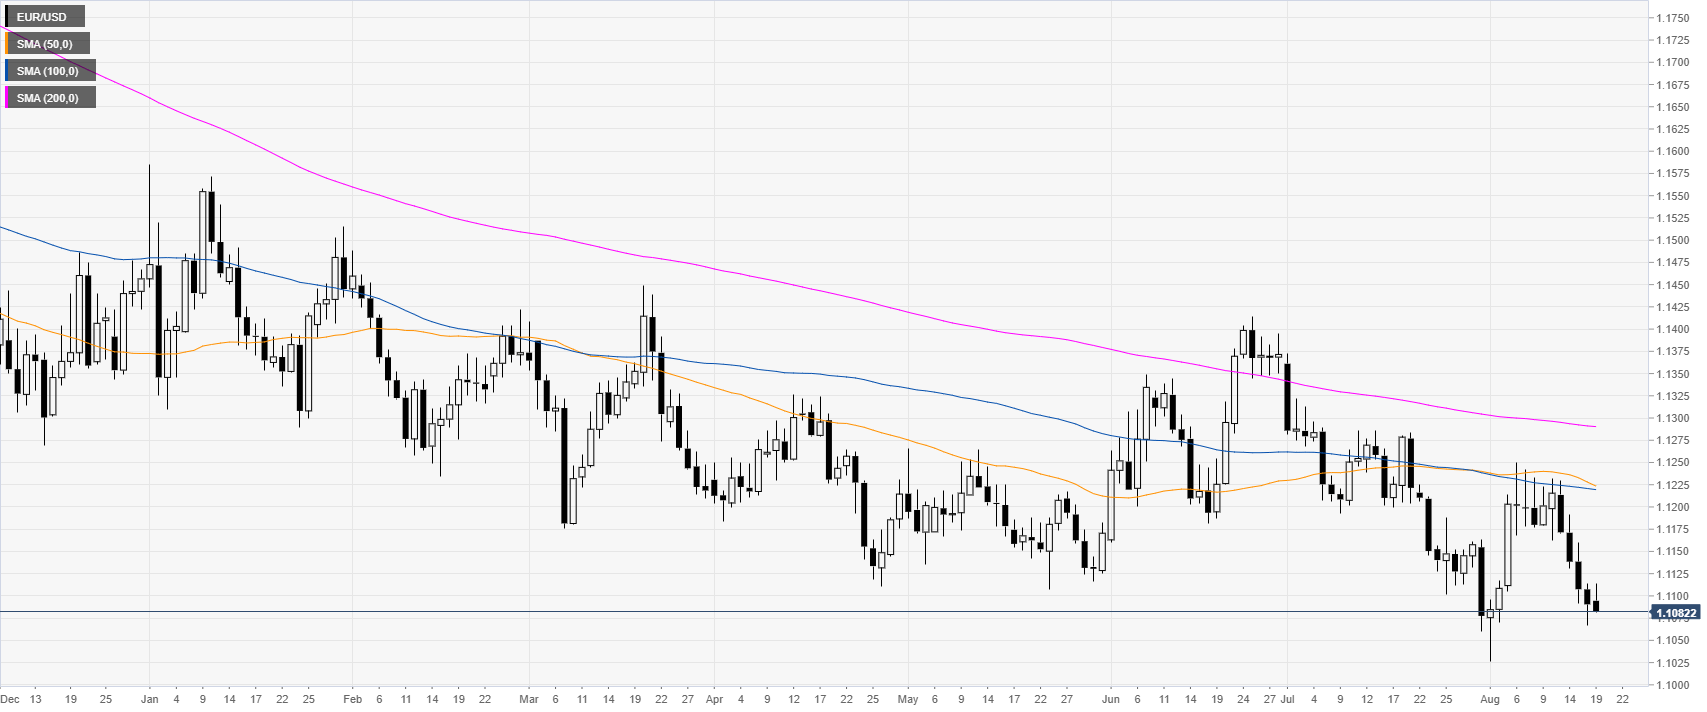
EUR/USD daily chart
On the daily time-frame, the single currency is trading in a bear trend below the main daily simple moving averages (DSMAs). The market is starting the week trading within a small range after last week decline.
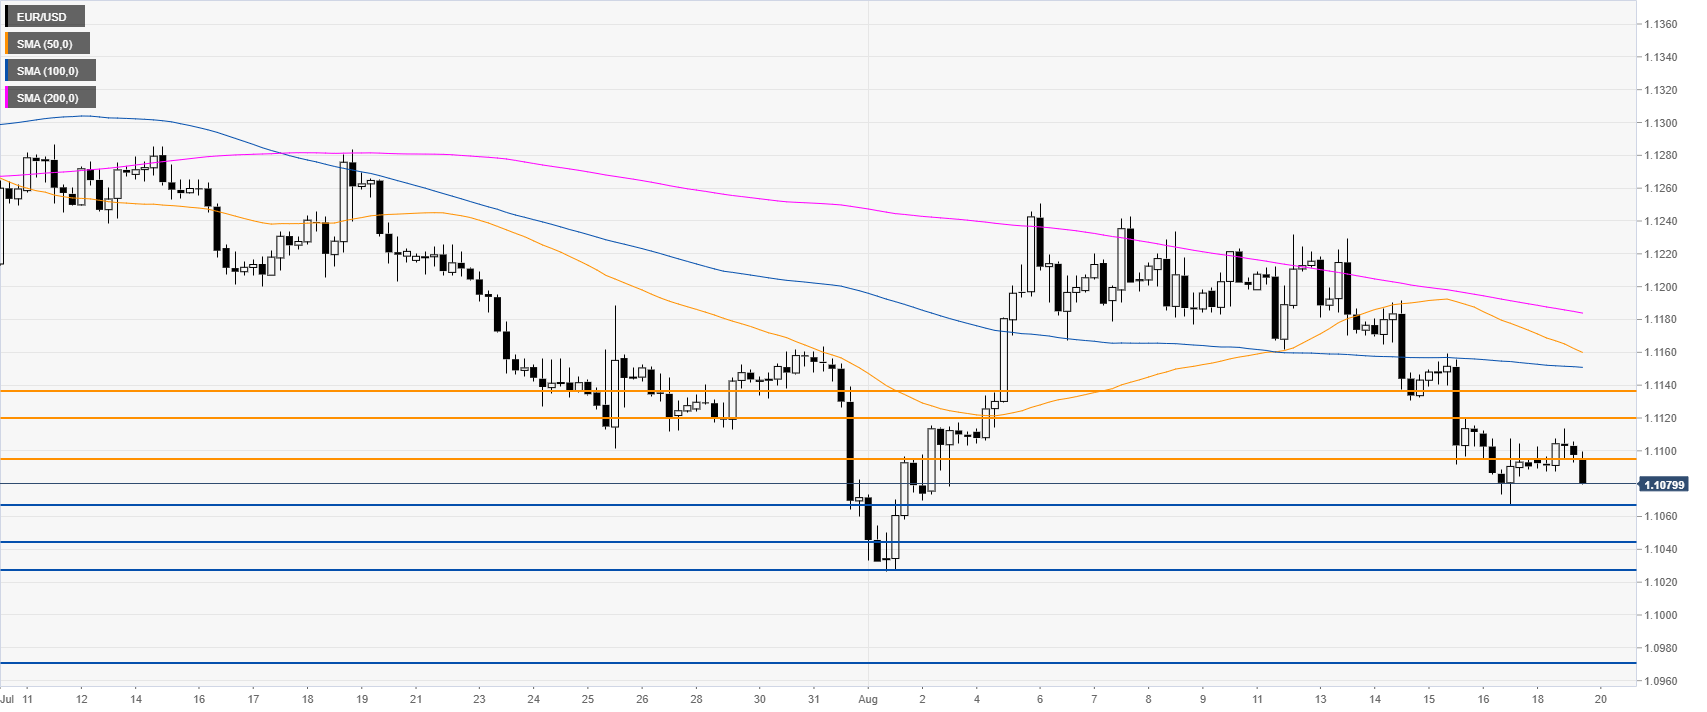
EUR/USD 4-hour chart
The Euro is trading below 1.1096 resistance and its main SMAs, suggesting a bearish bias in the medium term. Bears need a break below 1.1066 (last week low) to reach 1.1044, 1.1027 and the 1.0970 level on the way down.
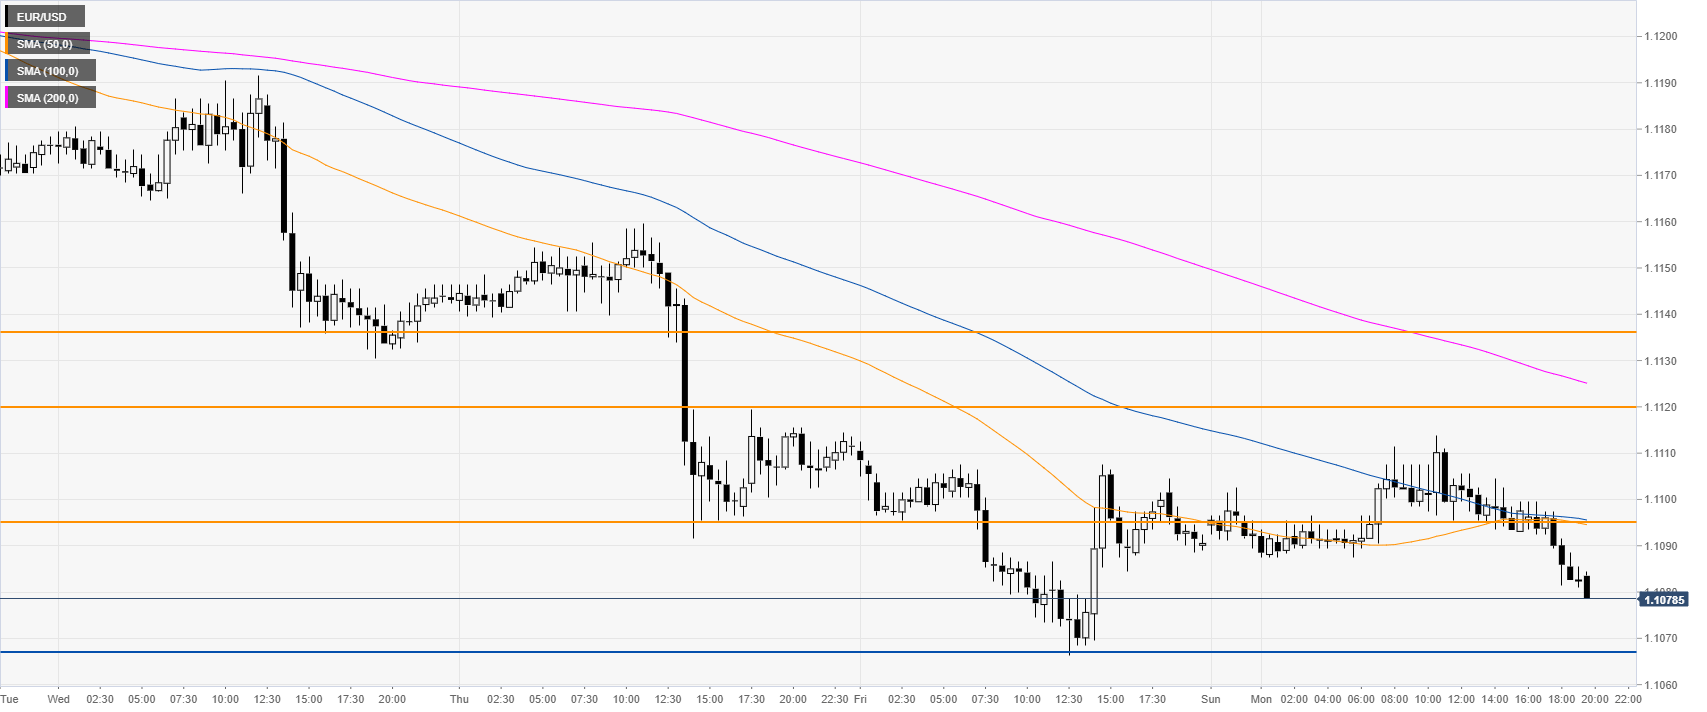
EUR/USD 30-minute chart
The market is trading below its main SMAs, suggesting a bearish bias in the near term. Immediate resistances are seen at the 1.1096, 1.1120 and 1.1136 levels, according to the Technical Confluences Indicator.