NZD/USD technical analysis: 21/50 hourly EMAs challenge latest pullback
- 5-day long support-line triggered the NZD/USD pair’s pullback.
- Short-term exponential moving averages (EMAs) limit the upside.
- RSI on the recovery mode from oversold conditions.
Even after bouncing off 5-day old support-line, NZD/USD is yet to offer a successful rise past key immediate EMAs as it trades near 0.6710 during early Wednesday morning in Asia.
With the 14-bar relative strength index (RSI) rising from oversold conditions, odds are in favor of the pair’s extended recovery towards latest high surrounding 0.6740. However, sustained trading beyond 0.6709/11 resistance confluence is a must for buyers to follow.
During the pair’s further upside beyond 0.6740, mid-April tops near 0.6785 can become bulls’ favorite.
Alternatively, a downside break of 0.6700 support-line can fetch the quote to 50% and 61.8% Fibonacci retracement of last one-week up-moves, around 0.6653 and 0.6633 respectively.
In case sellers dominate after 0.6633, 0.6600 and previous week low near 0.6570 could lure them.
NZD/USD hourly chart
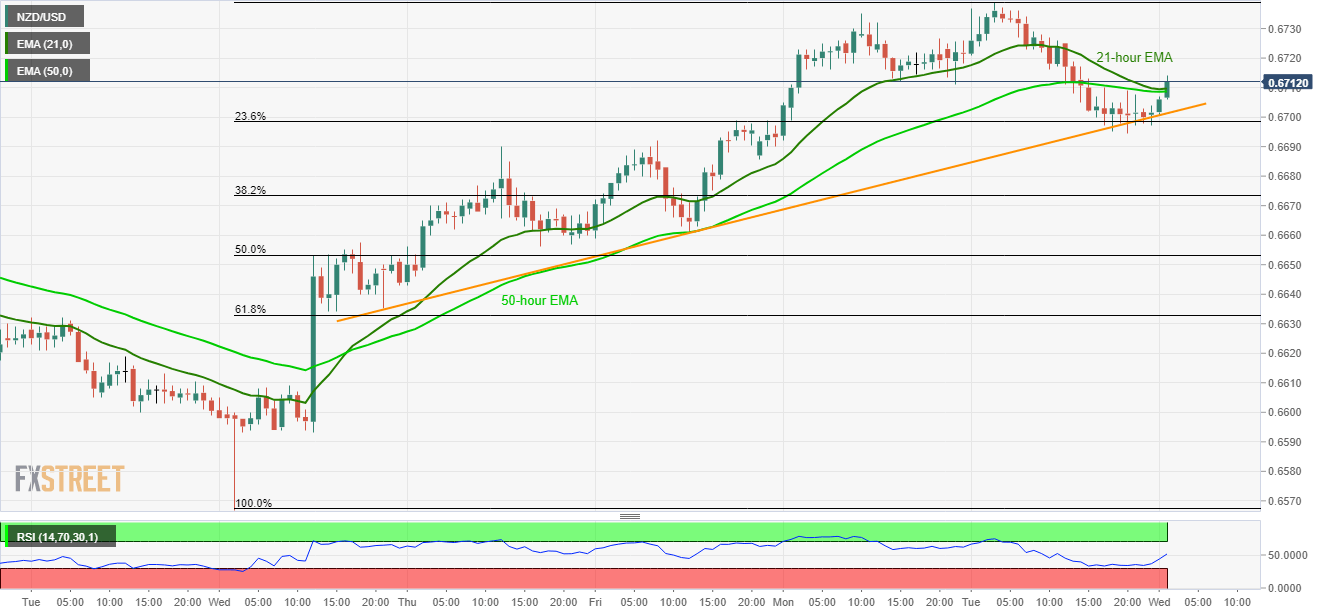
Trend: Bullish