13 Jun 2019
USD/JPY technical analysis: Greenback slows down near 108.55 resistance against Yen
- USD/JPY is trapped in a tight 50-pip range since Monday.
- 108.55 seems to offer some short-term resistance.
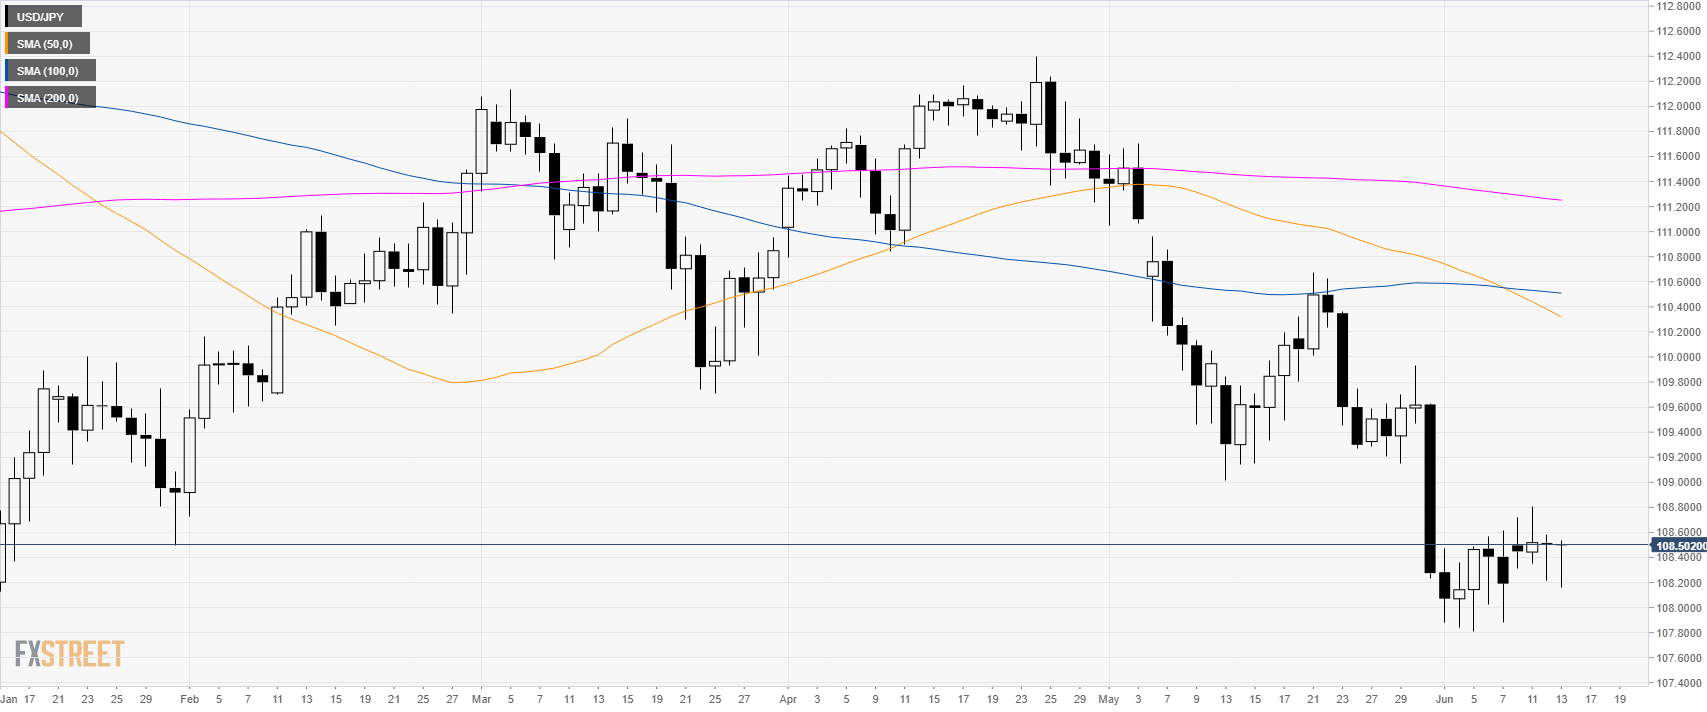
USD/JPY daily chart
USD/JPY is trading in a bear leg below the main daily simple moving averages (DSMAs).
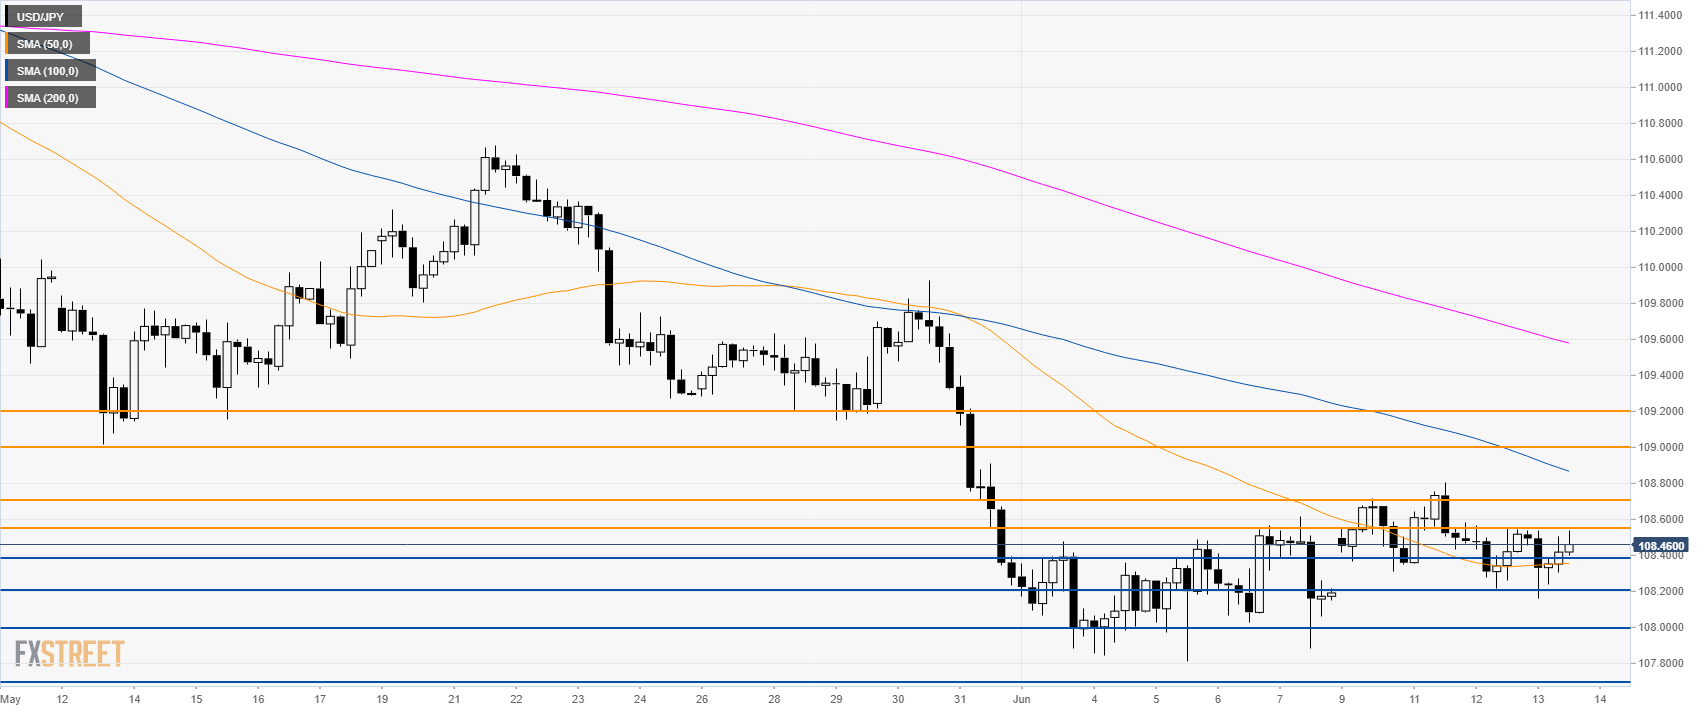
USD/JPY 4-hour chart
USD/JPY is consolidating above the 108.00 handle and the 50 SMA.
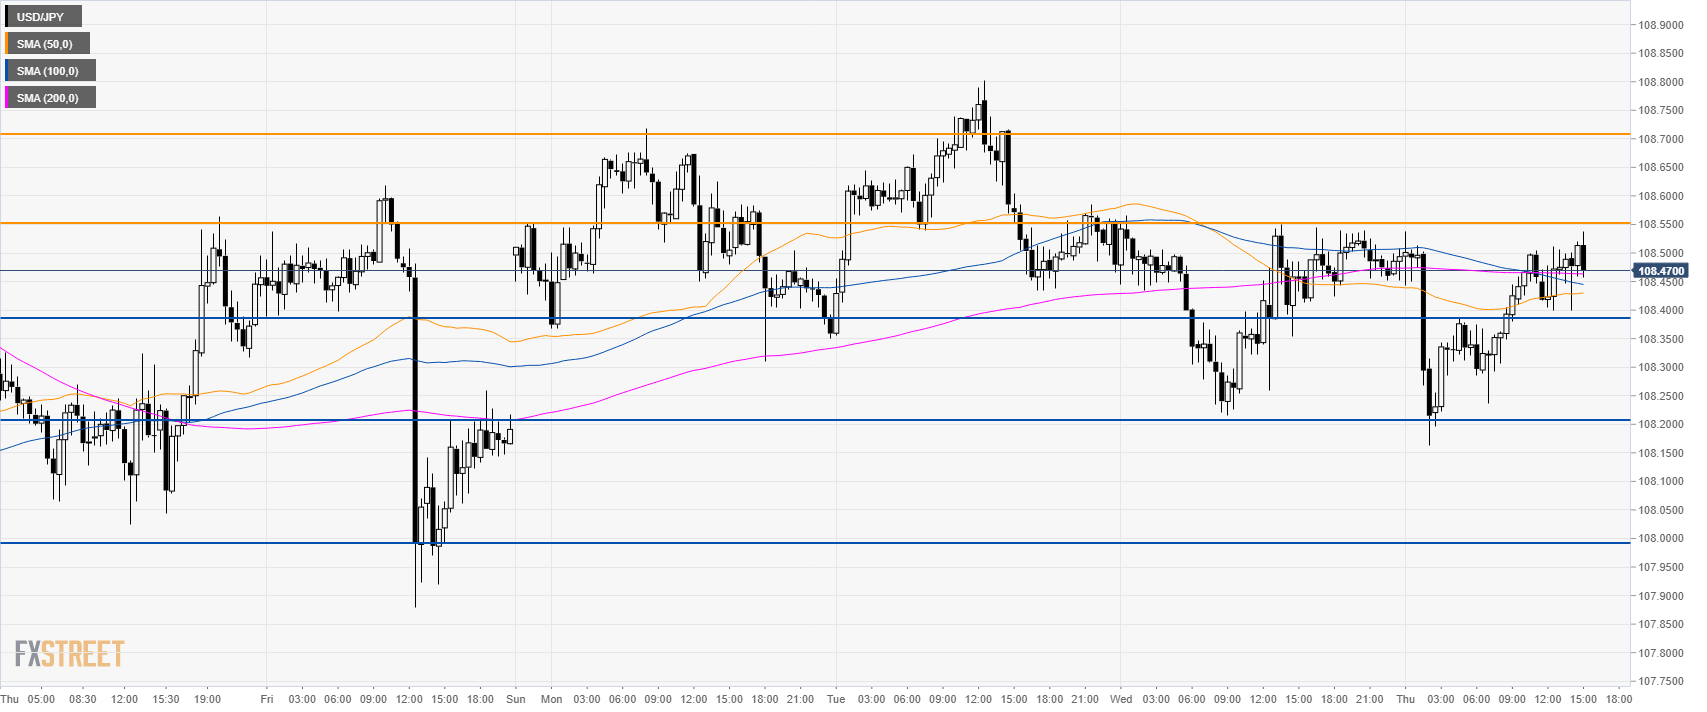
USD/JPY 30-minute chart
USD/JPY is trading in a range between 108.20 and 108.70. The market seems to have found decent resistance at 108.55. The next supports to the downside are seen at 108.40 and 108.20. A break above 108.55 can lead to 108.70.
Additional key levels