12 Jun 2019
EUR/USD technical analysis: Fiber dips near daily lows post-US inflation
- The US core inflation (YoY) missed expectations slightly coming in at 2.0% vs. 2.1% forecast.
- USD is gaining moderate strength as EUR/USD is unable so far to break beyond 1.1340 weekly high.
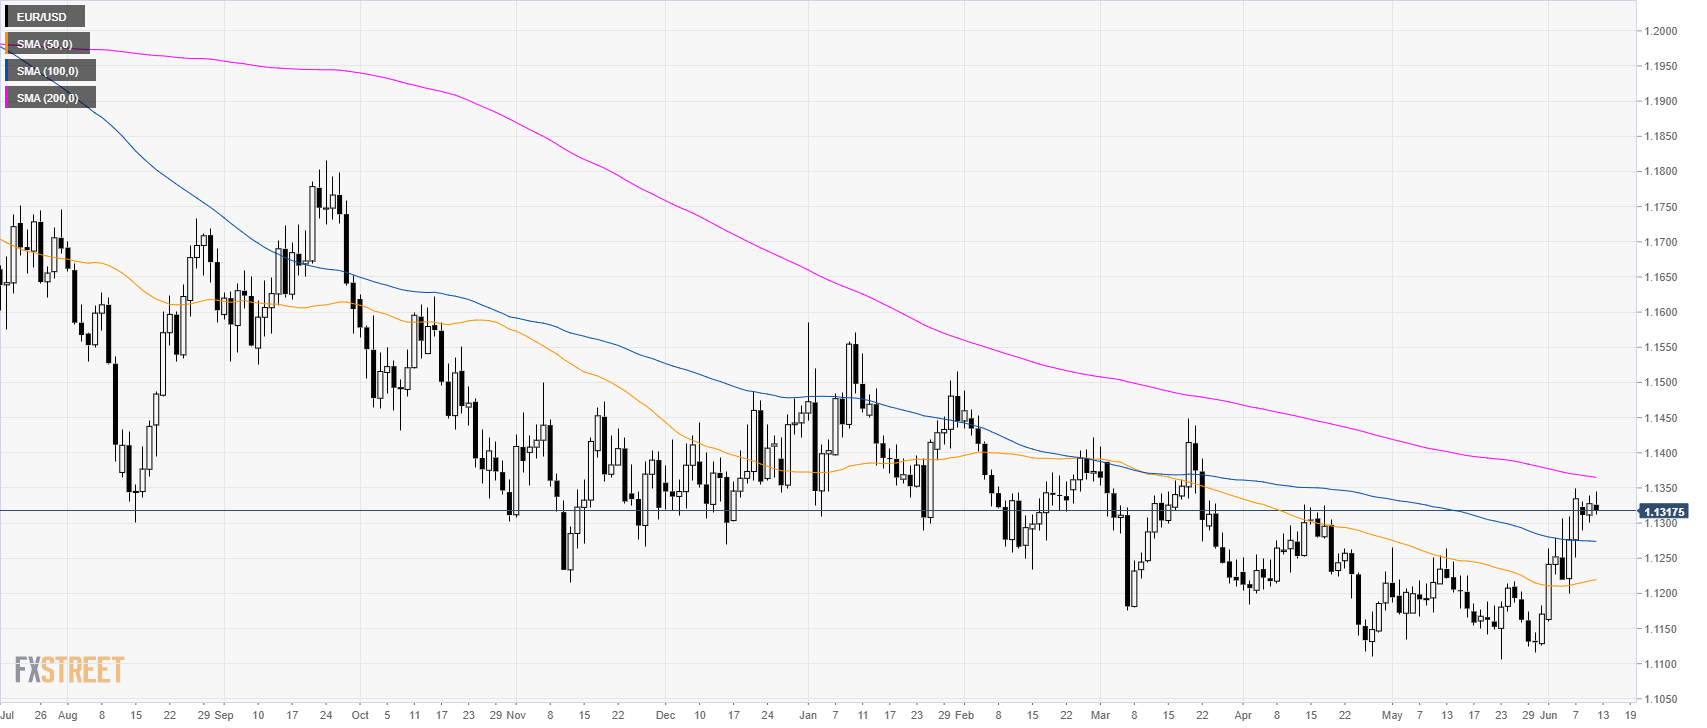
EUR/USD daily chart
EUR/USD is trading in a bear trend below its 200 simple moving averages (SMAs).
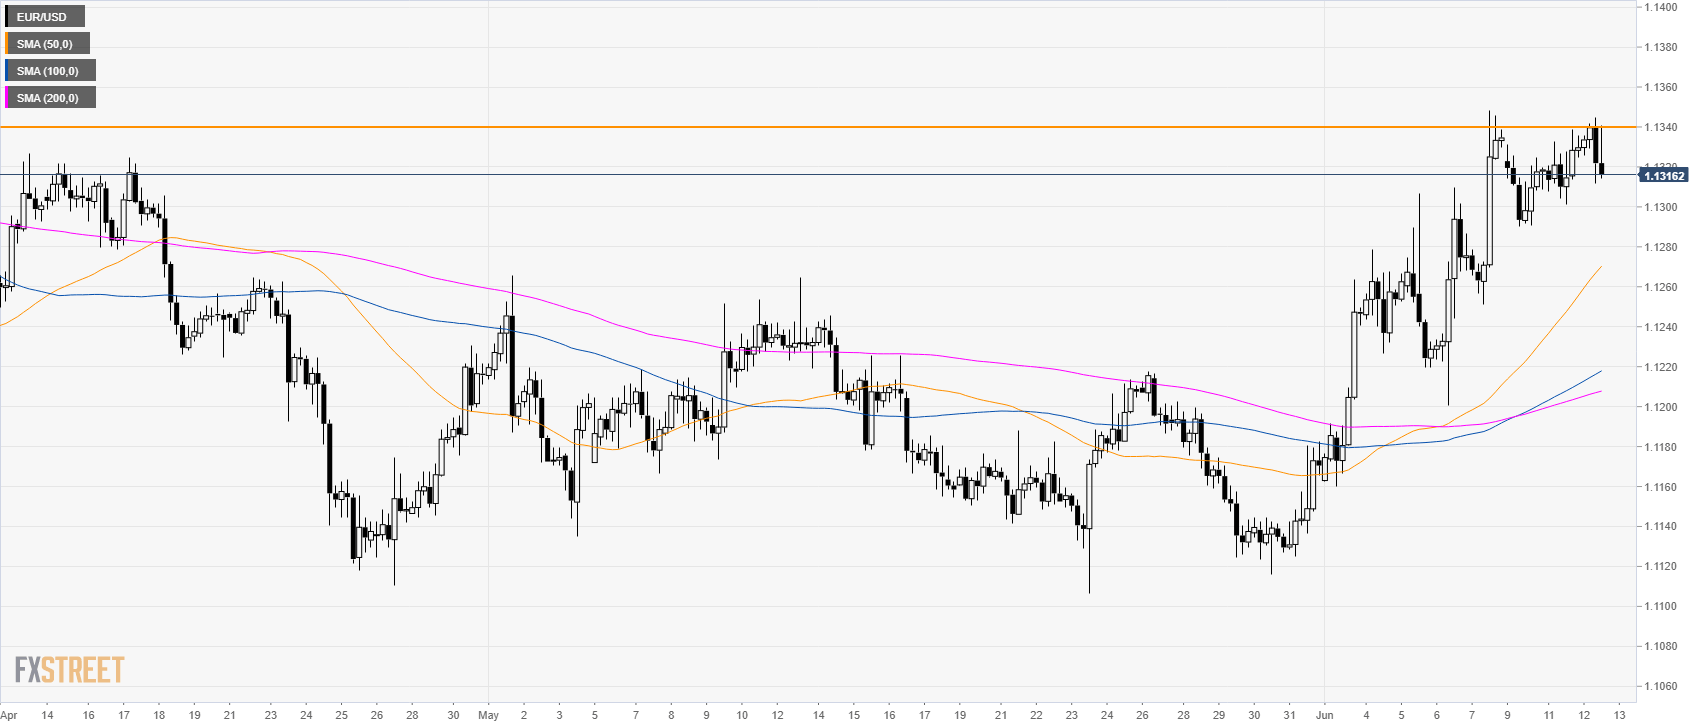
EUR/USD 4-hour chart
The market is currently rejecting the weekly high near 1.1340.
EUR/USD 30-minute chart
The market is trading in a tight range. Fiber is at daily lows below its 50 and 100 SMAs. A sustained break below 1.1300 would be seen as bearish. Further down lies 1.1250 and 1.1200 figure. A daily close above 1.1340 would be considered as bullish opening the gates towards 1.1400.
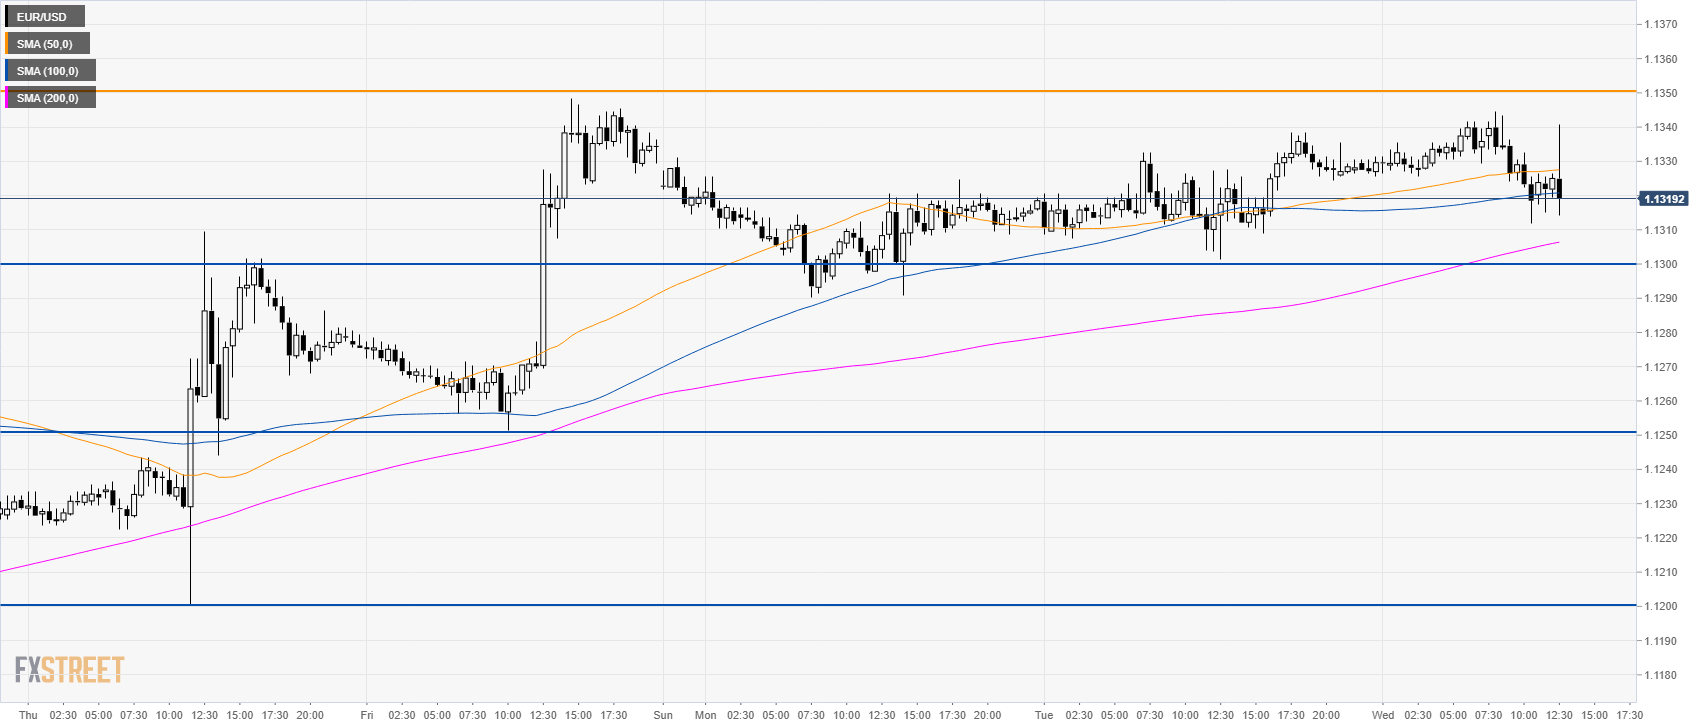
Additional key levels