4 Jun 2019
EUR/USD technical analysis: Fiber going down towards 1.1220
- The Core Consumer Price Index in May in the Eurozone came in below expectations at 0.8% vs. 0.9% forecast.
- EUR/USD is losing steam below the 1.1280 resistance.
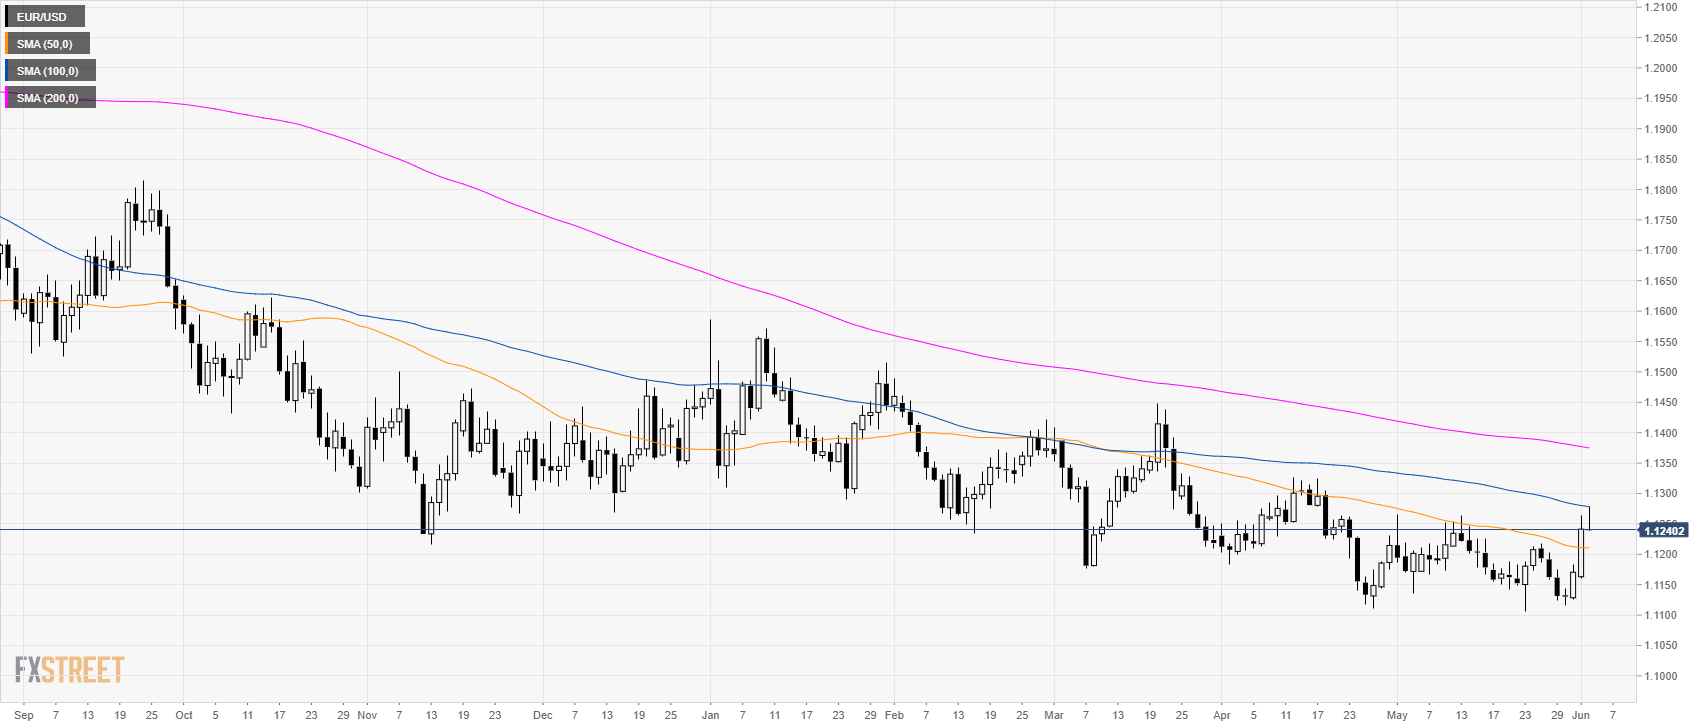
EUR/USD daily chart
EUR/USD is trading in a bear trend below the 100 and 200 simple moving averages (SMAs).
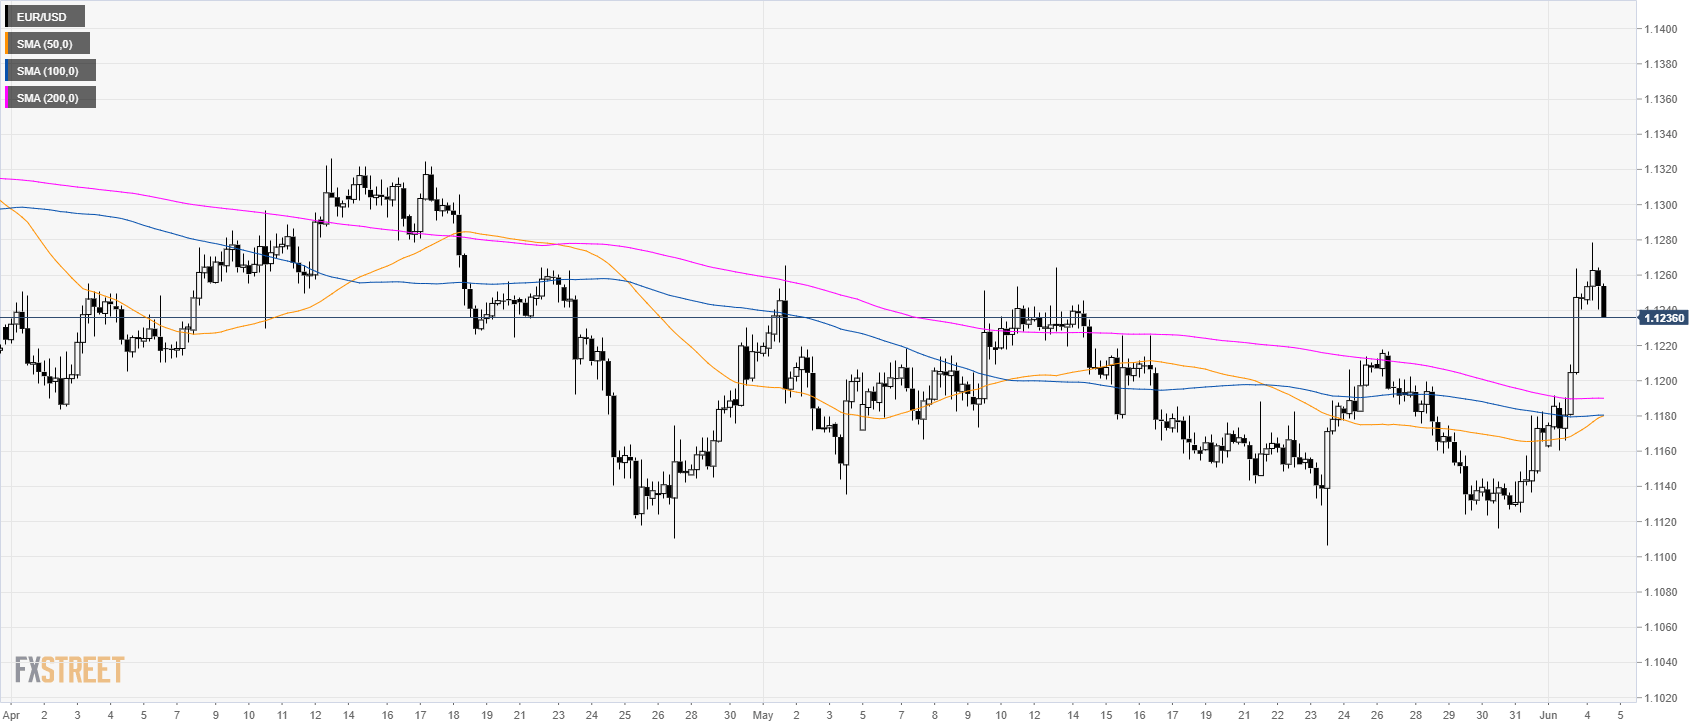
EUR/USD 4-hour chart
EUR/USD is trading above its main SMAs suggesting bullish momentum in the near term.
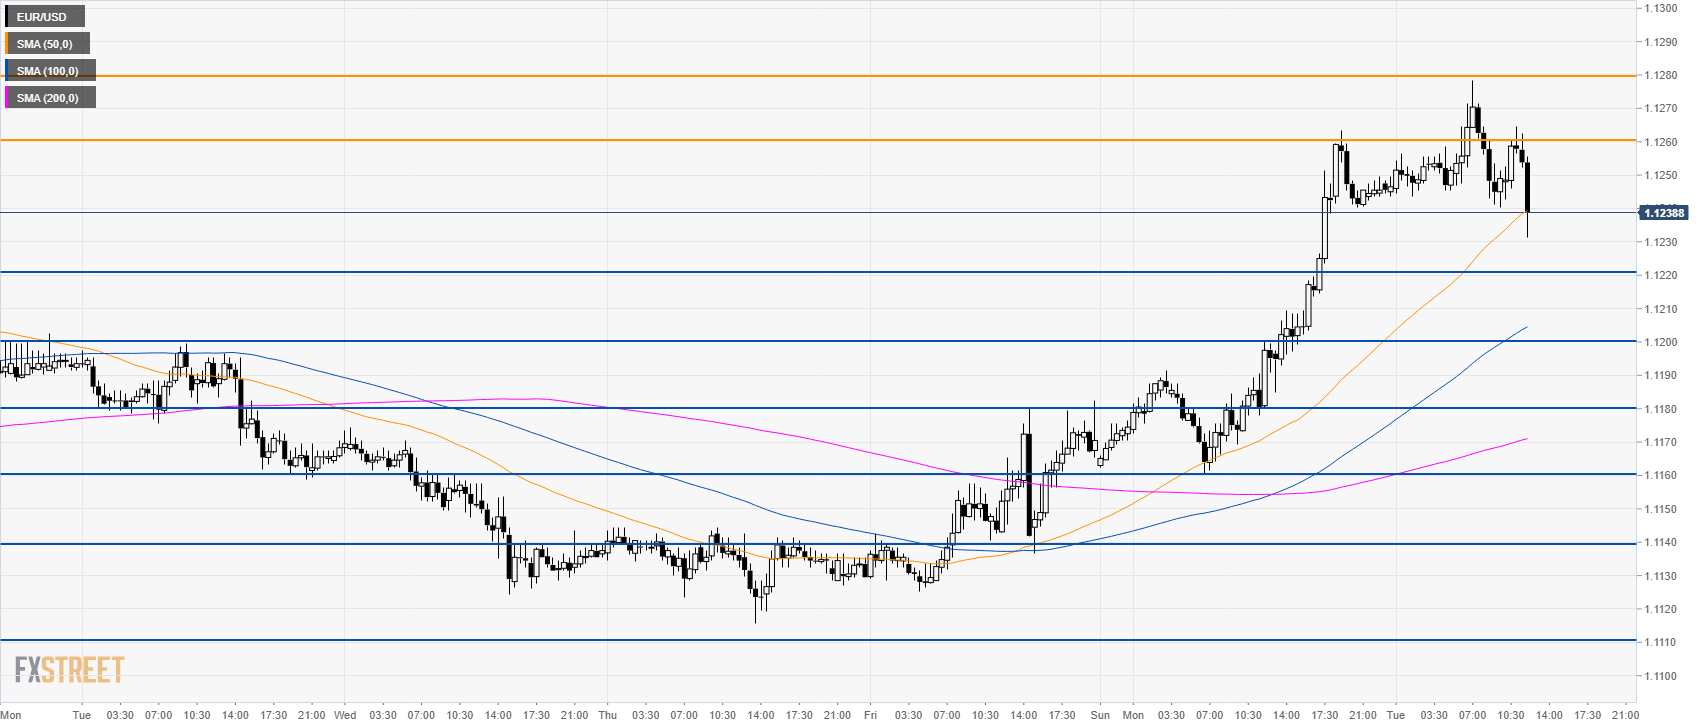
EUR/USD 30-minute chart
EUR/USD is dropping as the market trades below the 50 SMA. Support is seen at 1.1220, 1.1200 and 1.1180. Resistance is seen at 1.1260 and 1.1280.
Additional key levels