31 May 2019
Oil technical analysis: WTI falling to its lowest since March near $55.00 a barrel
- WTI is falling sharply and reaching levels not seen since March 2019.
- The level to beat for bears is $55.00 a barrel.
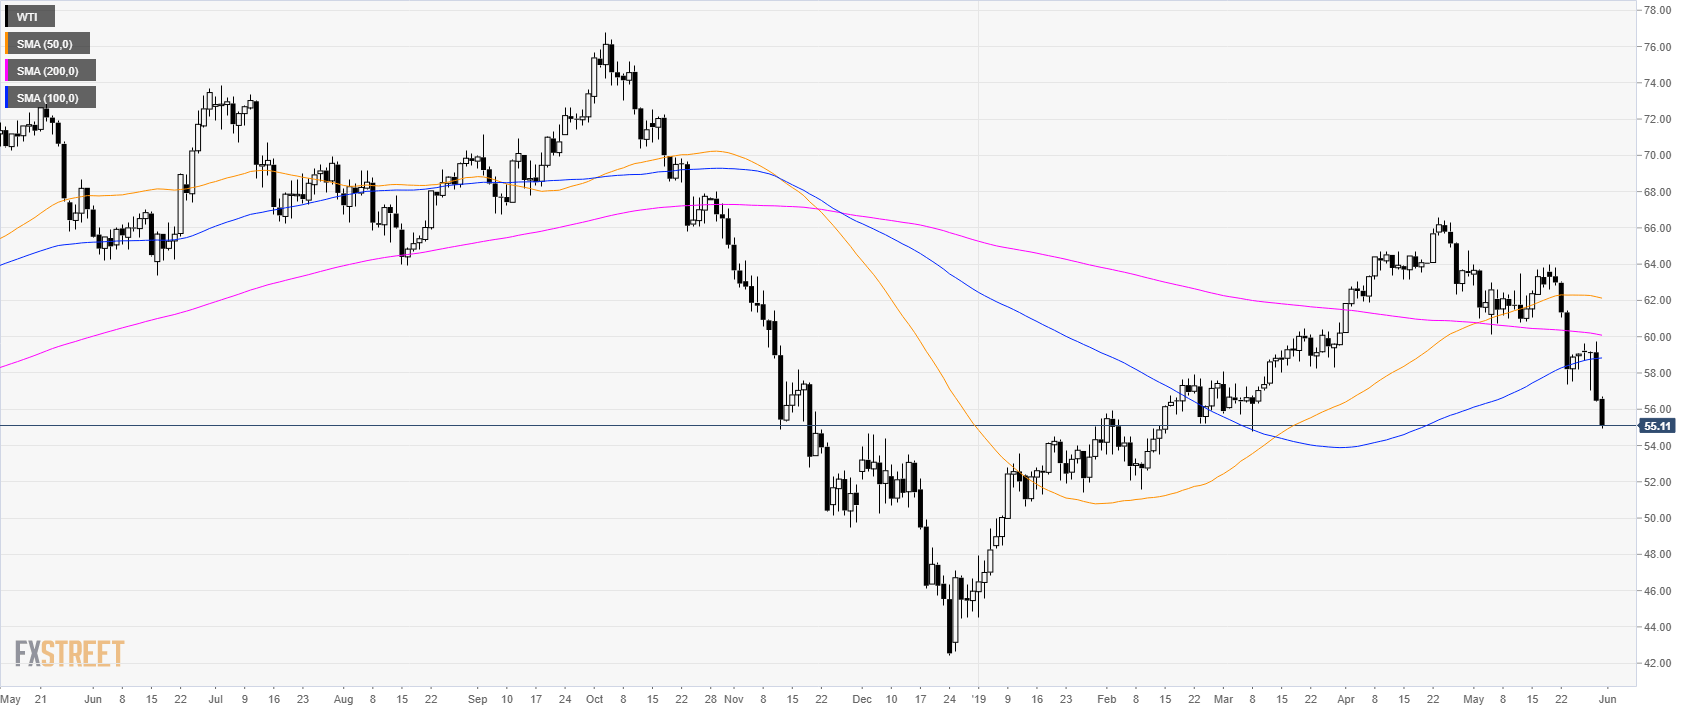
Oil daily chart
On the daily time frame, the WTI oil (West Texas Intermediate) is having a steep retracement down as the market is trading below its main simple moving averages (SMAs).
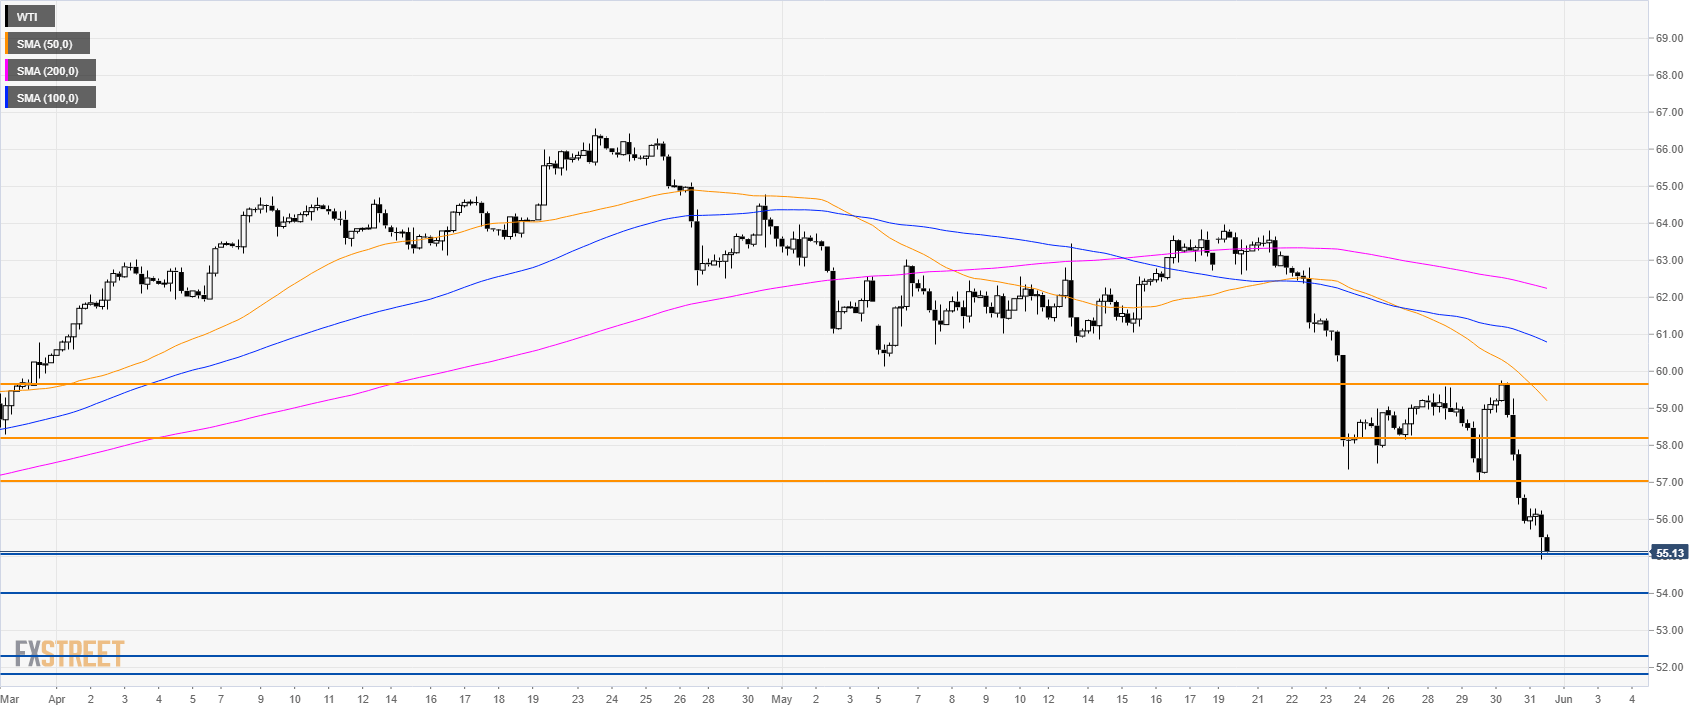
Oil 4-hour chart
WTI is dropping below its main SMAs. A beak below 55.00 can open the doors to 54.00, 52.30 and 51.80 to the downside. Resistance is seen at 57.00, 58.22 and 59.70.
Additional key levels