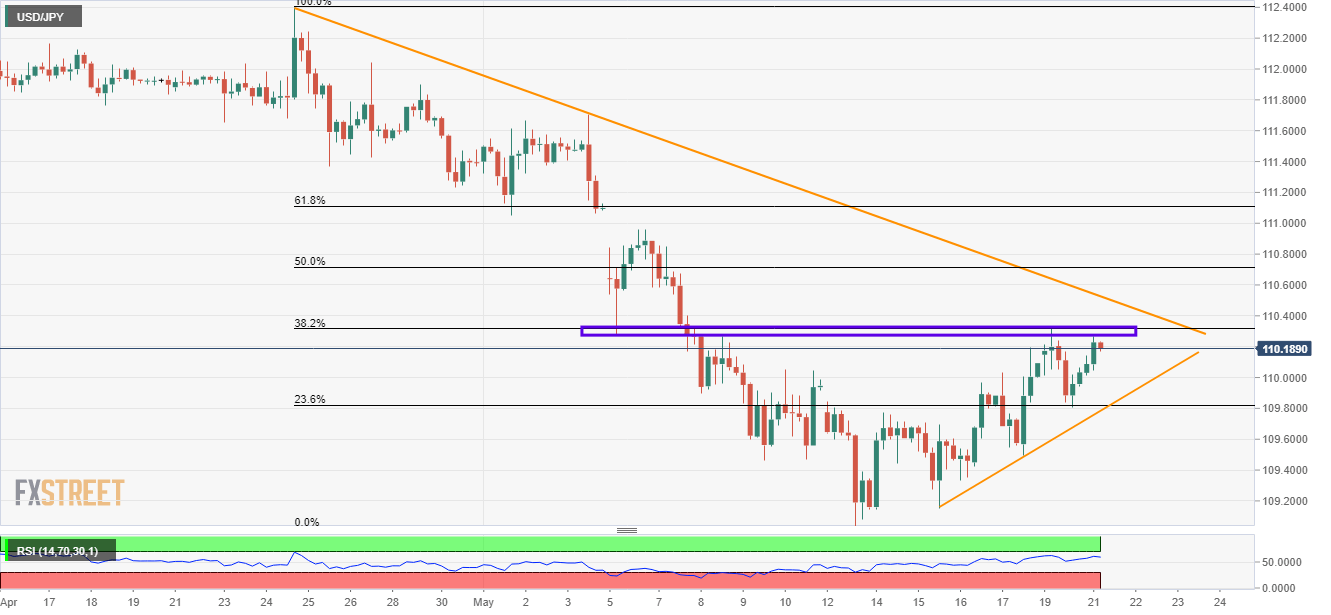
USD/JPY technical analysis: 110.30/35 limits upside towards 4-week old resistance-line
- Buyers rejected at immediate resistance-zone ahead of a trend-line barrier to the north.
- The steady increase from 109.00 portrays strength in upside momentum.
Gradual recovery from 109.00 seems struggling to clear immediate resistance area as USD/JPY trades near 110.20 ahead of Europe open on Tuesday.
Low of May 06 and highs marked afterward portray 110.30/35 as strong upside resistance for the pair near 38.2% Fibonacci retracement of its April to May downturn.
Should prices manage to clear 110.35 barriers, a run-up to descending trend-line stretched since April 24, at 110.55 can’t be denied.
Also, pair’s successful trade beyond 110.55 enables it to question 50% Fibonacci retracement level near 110.75 and 111.00 round-figure.
On the flipside, an upward sloping support-line from May 15 can limit the quote’s immediate declines near 109.80.
If sellers dominate past-109.80, 109.50 and 109.00 could come back to the charts.
USD/JPY 4-Hour chart
Trend: Pullback expected