Gold technical analysis: Set-up might have already turned in favor of bearish traders
• The precious metal extended last week's sharp retracement slide from levels just above the key $1300 psychological mark and remained under some selling pressure for the fifth consecutive session on Monday.
• The bearish pressure remained unabated despite a fresh wave of global risk-aversion trade, triggered by news that China is considering suspending business with suppliers who agreed to halt supplying Huawei.
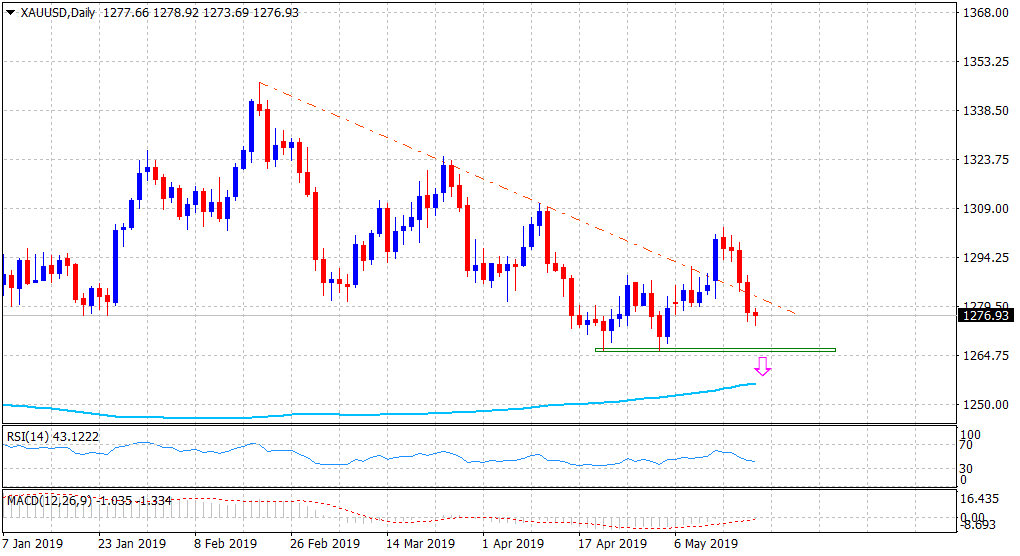
The commodity's inability to capitalize on the recent corrective bounce and a subsequent slide back below a previous descending trend-line resistance break-point - now turned support, clearly points to the resumption of the prior/well-established bearish trend.
Technical indicators on the daily chart have again started gaining negative momentum and reinforce the bearish outlook, albeit slightly oversold conditions on the 4-hourly chart held investors from placing aggressive bets and led to a consolidative price-action.
However, sustained weakness below the $1273-72 horizontal zone will set the stage for a further near-term depreciating move towards testing $1266 level before the commodity eventually drops to the very important 200-day SMA support near the $1255 region.
Gold daily chart