17 May 2019
EUR/USD technical analysis: Fiber is trading near 1.1160 close to the weekly low
- Earlier in the New York session, the Michigan Consumer Consumer Index for April came in better-than-anticipated at 102.4 vs. 97.5 forecast.
- EUR/USD dropped about 20 pips down from the 1.1180 resistance on the bullish US data.
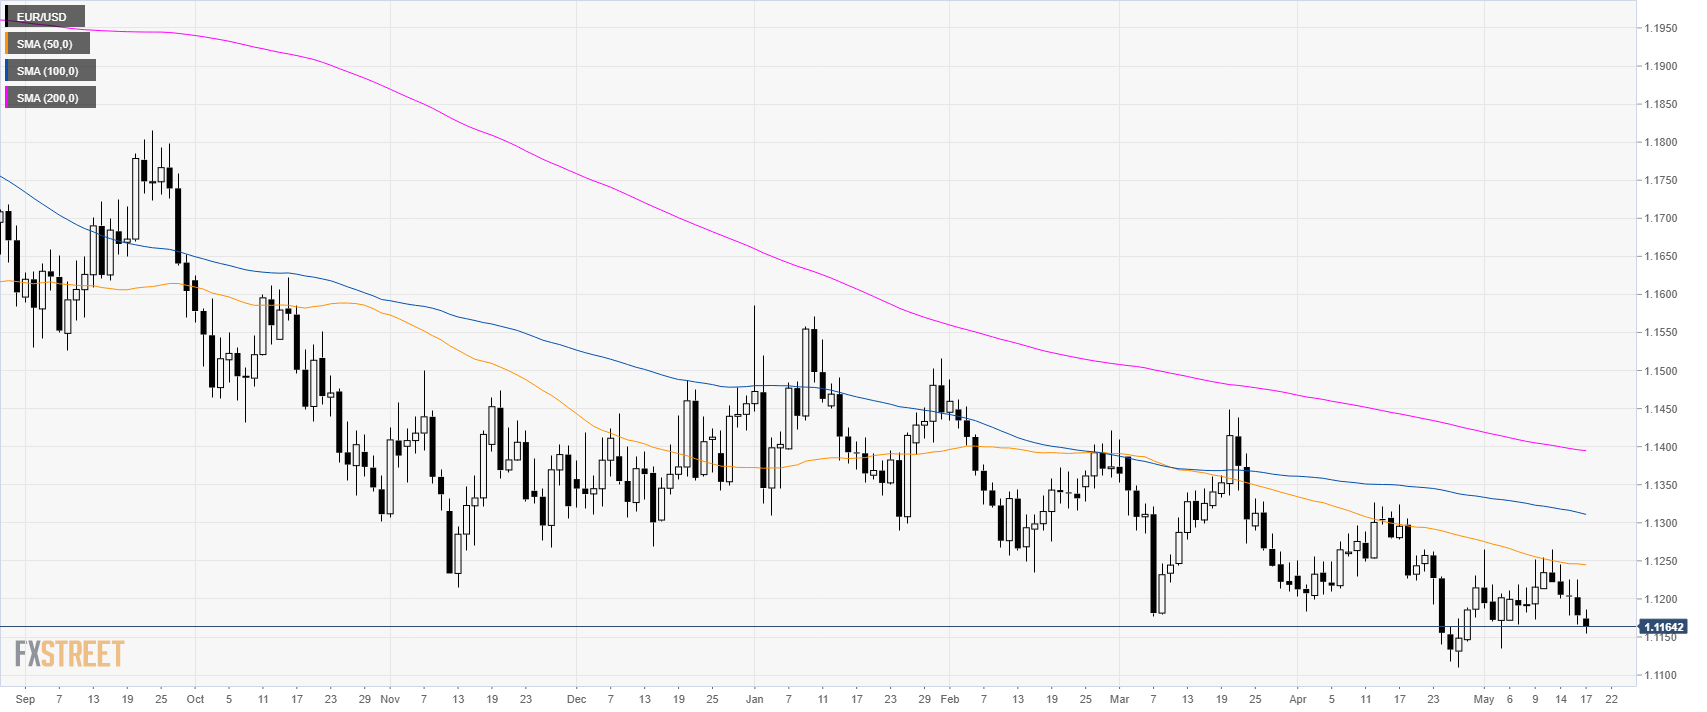
EUR/USD daily chart
EUR/USD is trading in a bear trend below its main simple moving averages (SMAs).
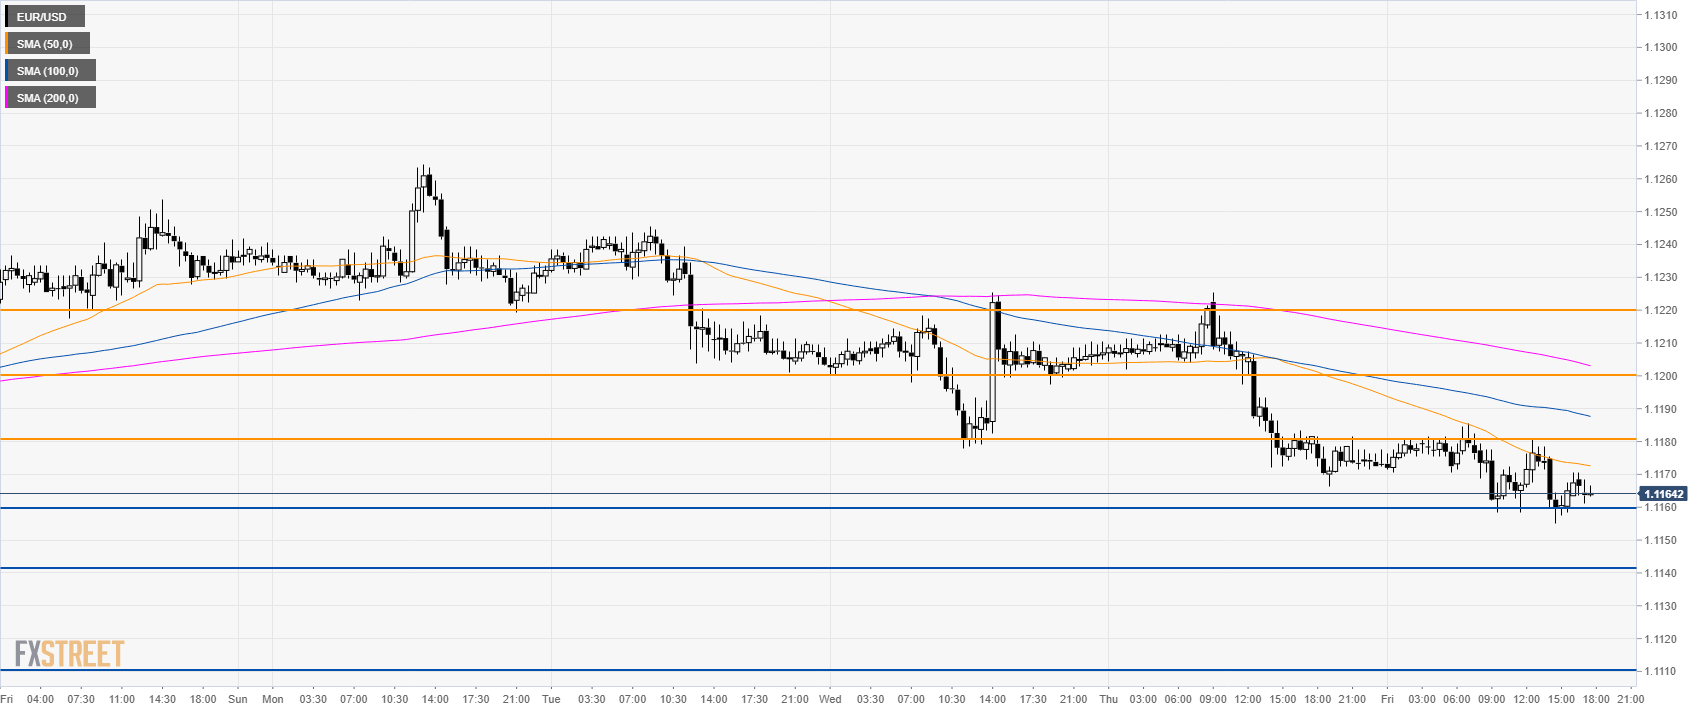
EUR/USD 4-hour chart
EUR/USD is trading below its main SMAs suggesting a bearish bias in the near term.

EUR/USD 30-minute chart
The market is trading below its main SMAs suggesting bearish momentum in the short term. The market is repeatedly challenging 1.1160 support. A break below this level can lead to 1.1140 and 1.1110 to the downside. Resistance is seen at 1.1180, 1.1200 and 1.1220 levels.
Additional key levels