15 May 2019
EUR/USD technical analysis: Fiber is down challenging 1.1200 the figure
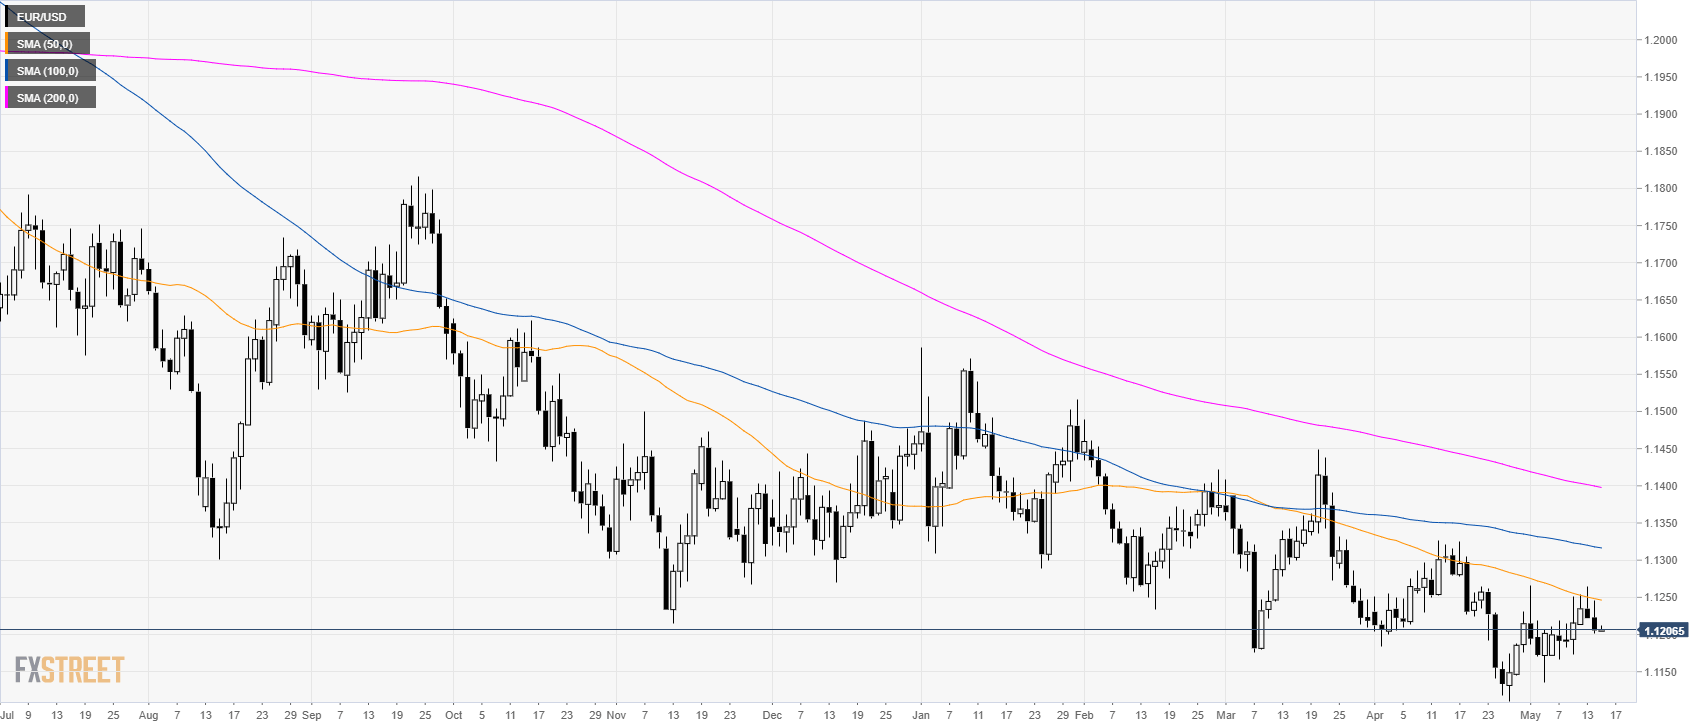
EUR/USD daily chart
EUR/USD is trading in a bear trend below its main simple moving averages (SMAs).
EUR/USD 4-hour chart
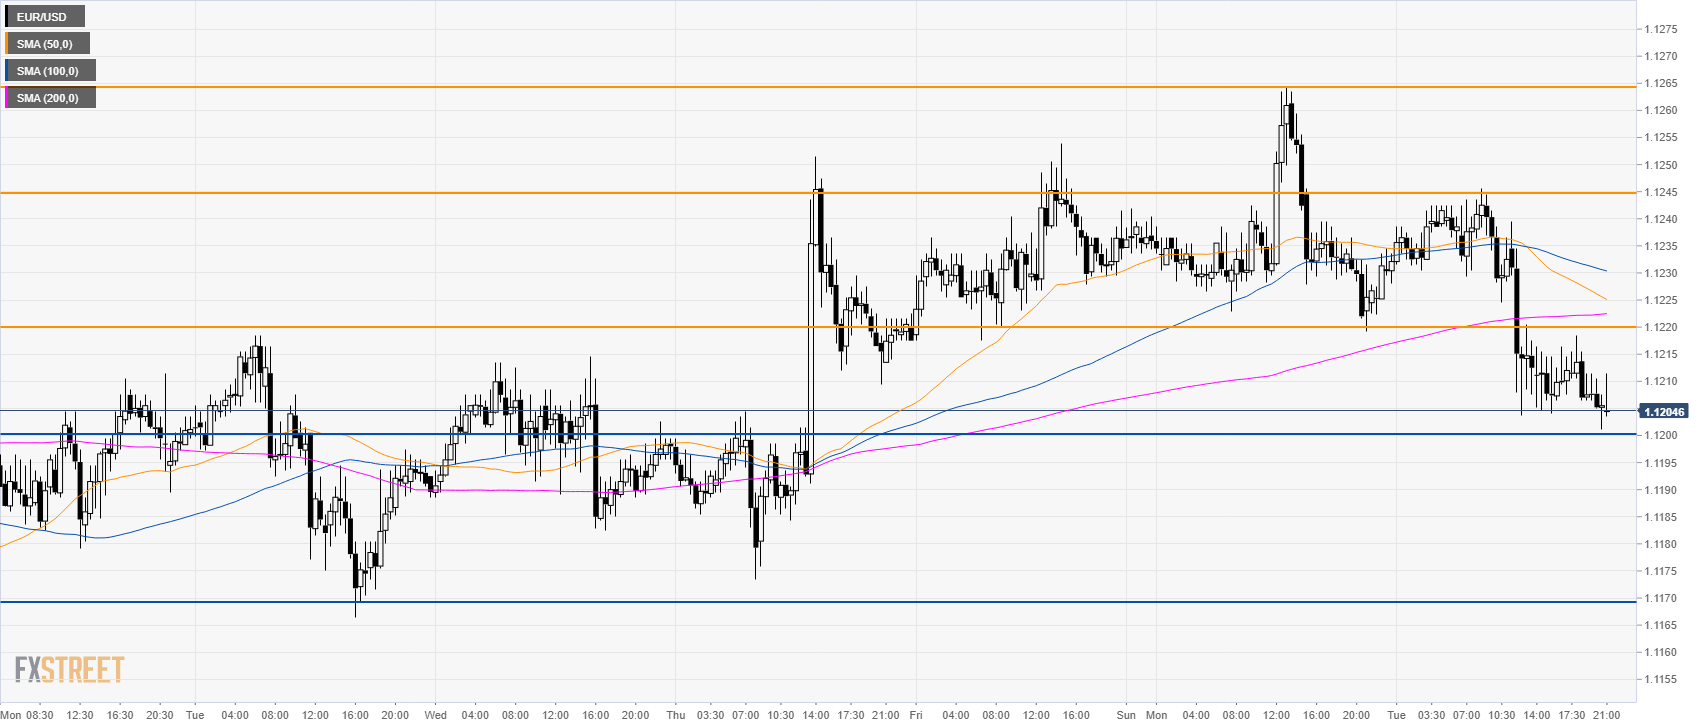
EUR/USD is challenging 1.1200 the figure and the 50 SMA.
EUR/USD 30-minute chart
The market is trading below its main SMAs suggesting a bearish bias in the short term. If sellers manage to break 1.1200 the next support is likely seen at 1.1170 level. Resistance is at 1.1220 and 1.1245 levels.
Additional key levels