USD/IDR Technical Analysis: 14,180 is the level to beat for buyers
USD/IDR is taking the rounds near 14,100 during early Monday.
The pair has been on a recovery mode since unofficial polls confirmed the present incumbent as the President of Indonesia.
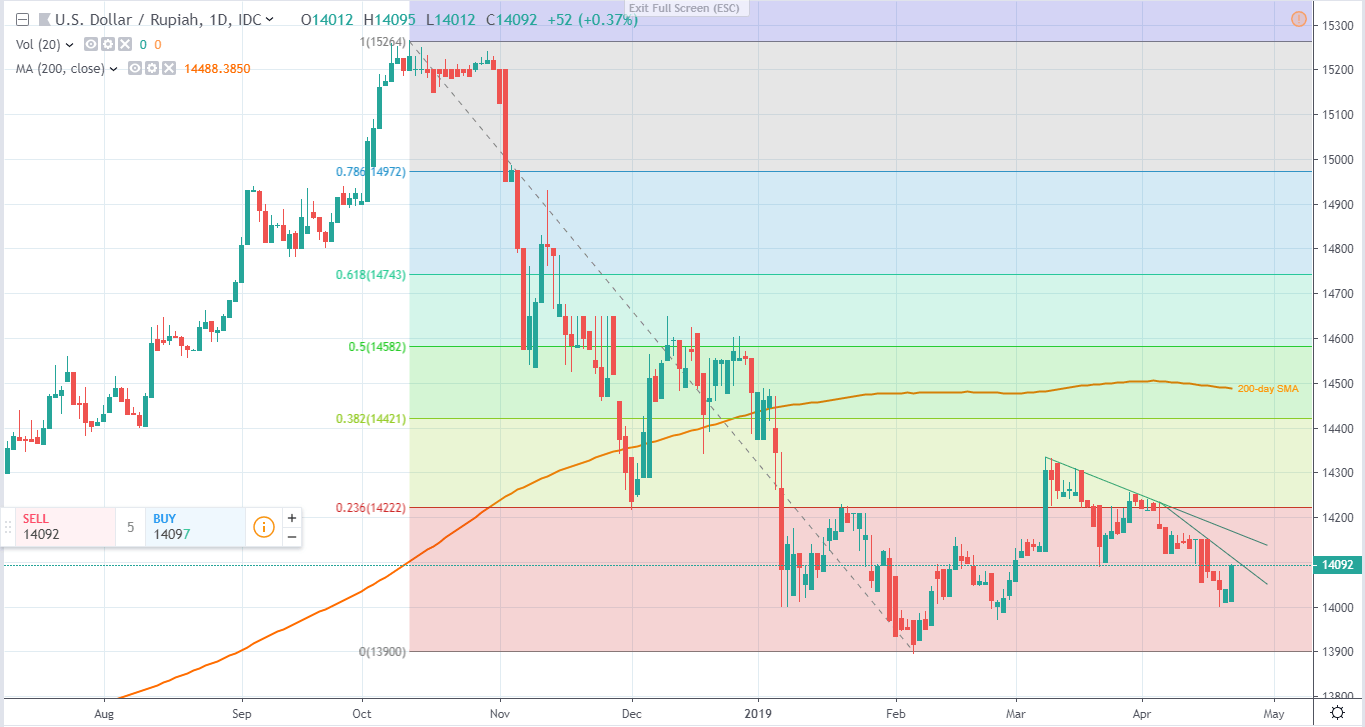
However, a downward sloping trend-line since April 04 at 14,110 and another resistance-line connecting March highs to the April ones, neat 14,180 can question buyers.
Should the Bulls manage to conquer 14,180 on a daily closing basis, 14,260 and 14,340 can act as intermediate halts ahead of highlighting 200-day simple moving average (SMA) near 14,490.
Meanwhile, 14,000 is likely acting as nearby support for the quote, a break of which can fetch the quote to February lows near 13,970.
Given the pair’s sustained downturn beneath 13,970, sellers can aim for 13,895 and June 2018 lows near 13,845.
USD/IDR daily chart
Trend: Pullback expected