2 Apr 2019
GBP/JPY Technical Analysis: Descending triangle on 4-Hour chart highlights 143.85/75 for sellers
- GBP/JPY trades little weak around 145.50 during early Tuesday.
- A short-term descending triangle formation is underway if observing the trading patterns since February 22.
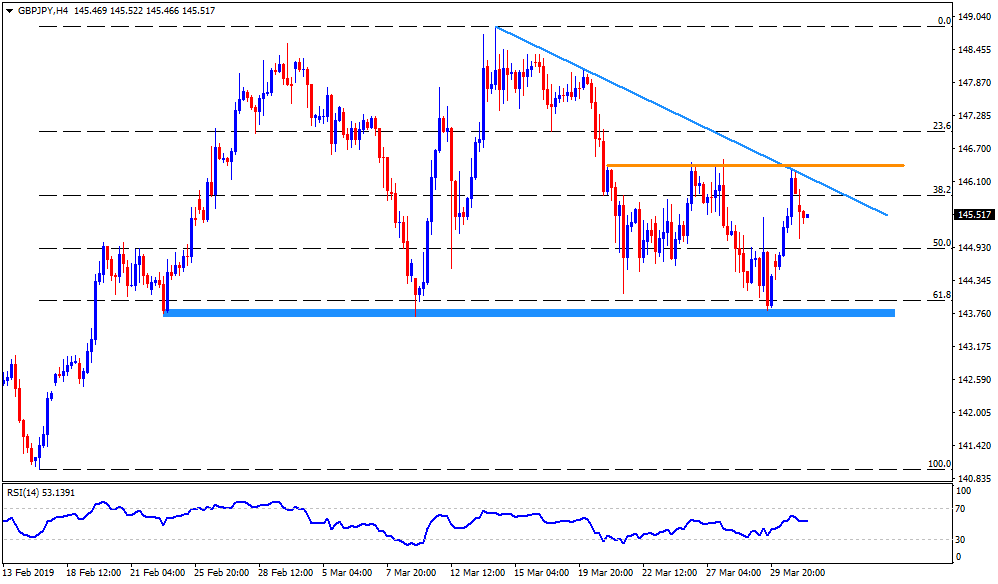
- Given the quote’s recent pullback from the pattern resistance-line stretched since March 14, chances of its decline to 144.60 can’t be denied.
- However, the formation support-zone near 143.85/75 could confine the pair’s downside under 144.60.
- In a case prices continue trading southwards past-143.75, 143.00 and 141.85 can entertain sellers ahead of pleasing them with mid-February lows near 141.00.
- Meanwhile, an upside clearance of 146.25 pattern resistance can take a halt around 146.40 horizontal-line connecting recent lows.
- Further, the break of 146.40 can validate the pair’s rise in a direction to 147.35/40 and 148.40 ahead of flashing 148.90 on the Bulls’ radar.
- Additionally, the pair’s rise above 148.90 enables buyers to aim for 150.00 round-figure.
GBP/JPY 4-Hour chart