2 Apr 2019
AUD/JPY Technical Analysis: Optimists need to conquer rising wedge resistance on hourly, 100-day SMA on daily chart
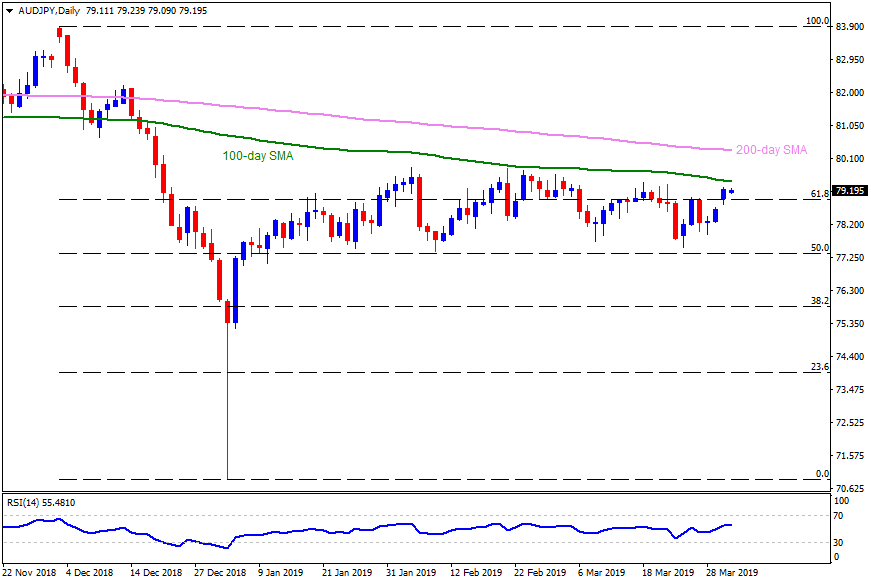
AUD/JPY daily chart
- AUD/JPY is trading around 79.20 in the hours of Tuesday.
- Having breached 61.8% Fibonacci retracement of its December – January downturn, 100-day simple moving average (SMA) figure of 79.50 seems crucial for buyers to watch as it has capped the quote’s upside since mid-December 2018.
- Should there be a daily closing beyond 79.50, February high near 79.85 can act as an intermediate halt ahead of highlighting 80.00 round-figure.
- Additionally, the pair’s upside past-80.00 can shift buyers’ attention to 200-day SMA level of 80.35.
- Meanwhile, a D1 close under 61.8% Fibonacci retracement level of 78.90 can recall 78.40 and 78.00 on the chart.
- Given the prices continue trading southwards beneath 78.00, March month low near 77.50, followed by 77.50 mark, should become sellers’ favorites.
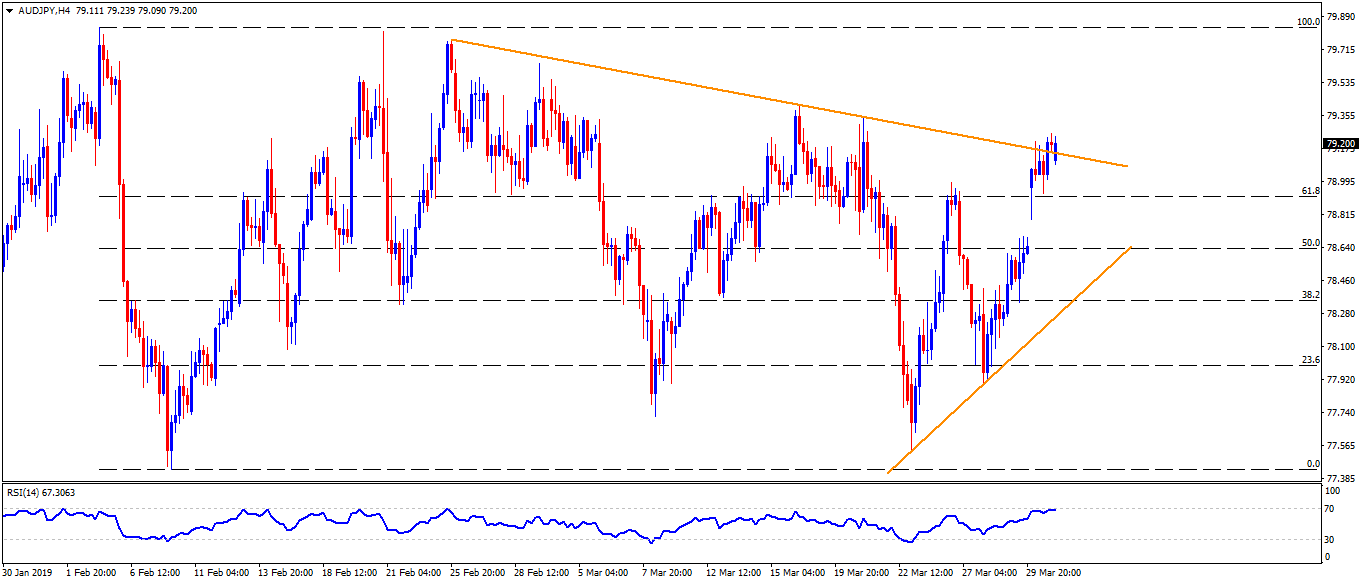
AUD/JPY 4-Hour chart
- The AUD/JPY pair should clear 79.30 in order to validate break of five-week-old descending trend-line and rise towards 79.50 resistance.
- Alternatively, 78.70 and upward sloping trend-line at 78.30 are likely extra supports to observe.
AUD/JPY hourly chart
- The upper line of the week-long “Rising Wedge” formation also highlights 79.30 as important resistance.
- However, a downside break of 78.80 can confirm the bearish chart pattern indicating the pair’s plunge towards 77.70.
