15 Oct 2018
Gold Technical Analysis: Yellow Metal consolidating gains above $1,220.00/oz after big breakout
- Gold broke above the multi-week range switching the main bias to bullish.
- Gold is now consolidating the recent gains below 1,237.60 (July 3 swing low). The RSI and Stochastic are printing a divergence suggesting a potential pullback down. Although the pullback might extend towards 1,220.90 (July 18 low) the bias remains bullish.
- A bear breakout below 1,204.10 (August 3 swing low key level) would be seen as a warning signal for bulls.
Gold 4-hour chart
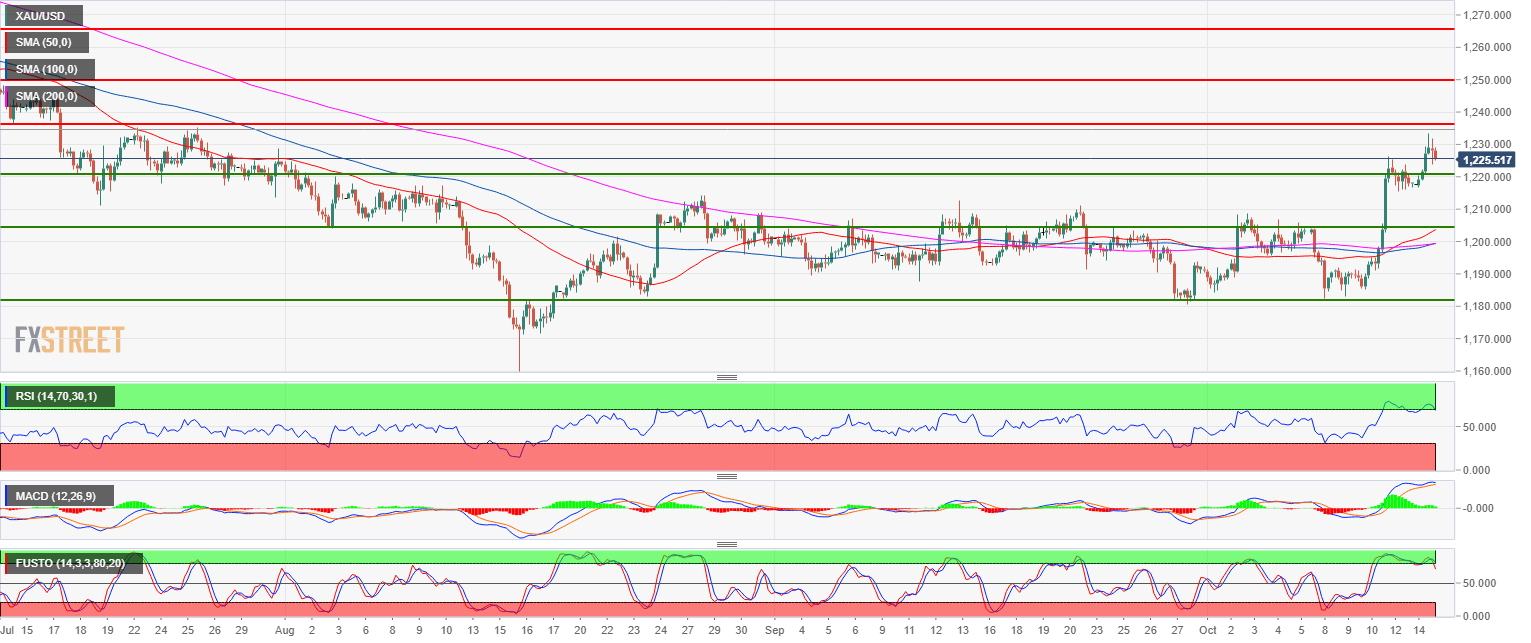
Rate: 1,225.92
Relative change: 0.67%
High: 1,233.30
Low: 1,216.55
Main trend: Bullish
Resistance 1: 1,237.60 July 3 swing low
Resistance 2: 1,250.00 figure
Resistance 3: 1,265.90 July high
Support 1: 1,220.90 July 18 low
Support 2: 1,211.17 July 19 low
Support 3: 1,204.10, August 3 swing low (key level)
Support 4: 1,182.90 August 24 low
Support 5: 1,172.82 current 2018 low