Gold Technical Analysis: recovery attempts likely to get sold into
• Reviving safe-haven demand, led by escalating US-China trade tension, eased the bearish pressure and helped bounce off YTD lows.
• The commodity remains well below short/medium/longer-term moving averages and hence, any meaningful recovery might be seen as an opportunity to initiate fresh bearish positions.
• A medium-term ascending trend-line, extending from Jan. 2017 lows through lows touched in July/Dec. 2017, might come into play amid bearish short-term technical indicators.
Gold daily chart
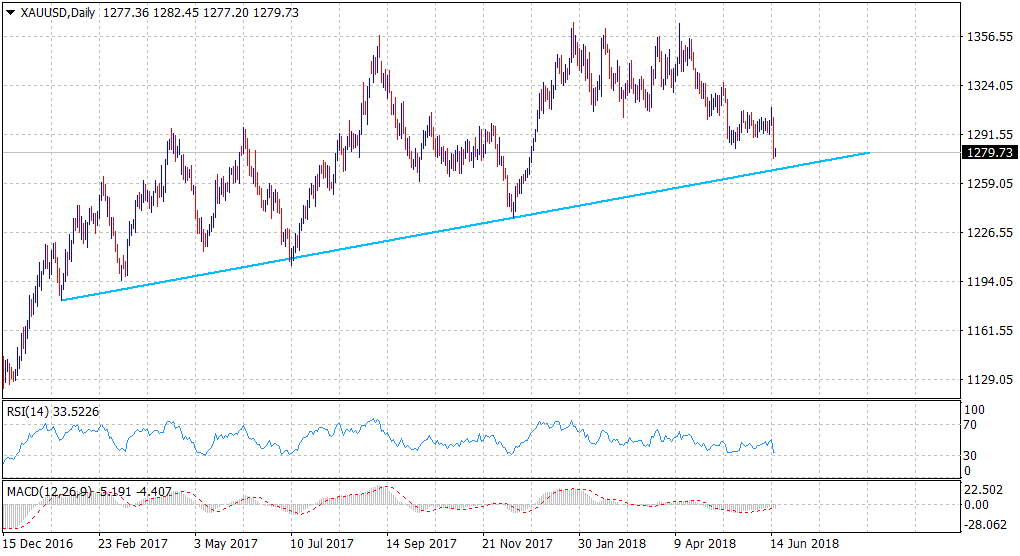
Spot Rate: $1279.73
Daily High: $1282.45
Daily Low: $1277.20
Trend: Bearish
Resistance
R1: $1282-83 zone (previous swing low and current day high)
R2: 1290 (horizontal level)
R3: $1296 (20-day SMA)
Support
S1: $1276 (YTD low set on Friday)
S2: $1268 (ascending trend-line)
S3: $1261 (Oct. 2017 swing low)