USD/CAD Technical Analysis: likely to aim towards testing rising wedge resistance
• Bulls build on the positive momentum further beyond the key 1.30 psychological mark, reinforcing last week's rebound from a short-term ascending trend-line support.
• A follow-through up-move has the potential to continue lifting the pair further towards another ascending trend-line resistance, forming a part of a rising wedge pattern on daily charts.
• Short-term technical indicators hold in bullish territory and remain supportive, albeit repositioning trade ahead of today's highly anticipated FOMC decision could negate bullish expectations.
USD/CAD daily chart
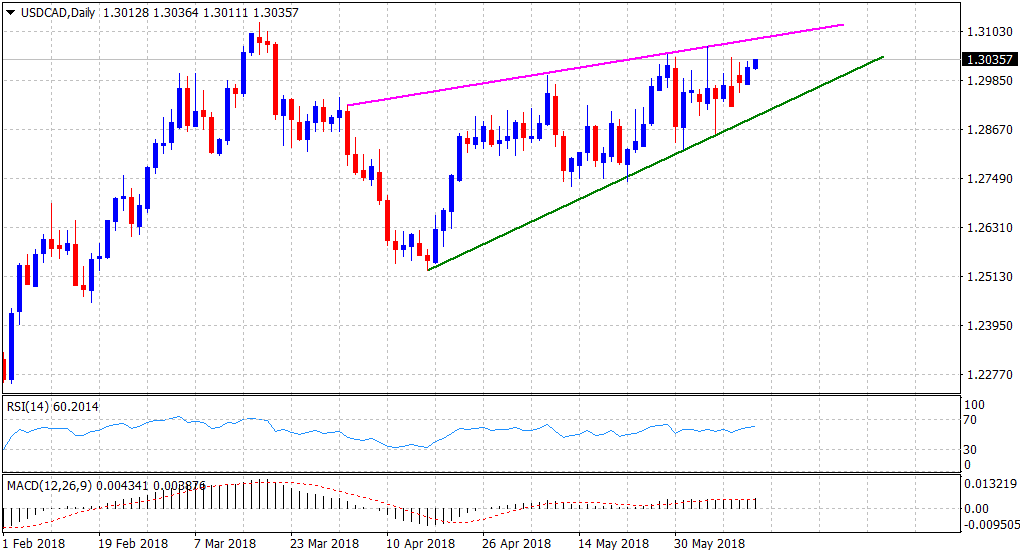
Spot Rate: 1.3036
Daily Low: 1.3011
Trend: Bullish
Resistance
R1: 1.3067 (2-1/2 month tops set last Tuesday)
R2: 1.3085 (ascending trend-line)
R3: 1.3125 (March 19 swing high)
Support
S1: 1.3000 (psychological round figure mark)
S2: 1.2984 (100-period SMA H1)
S3: 1.2955 (Monday's weekly low)