GBP/USD Technical Analysis: Pond bounces near daily lows

  • GBP/USD is bouncing from the 1.3360 area after losing about 70 pips after an attempt to break the 1.3420 level.
  • GBP/USD is stuck in a trading range since last week as the pair has lost a clear directionality


GBP/USD 15-minute chart
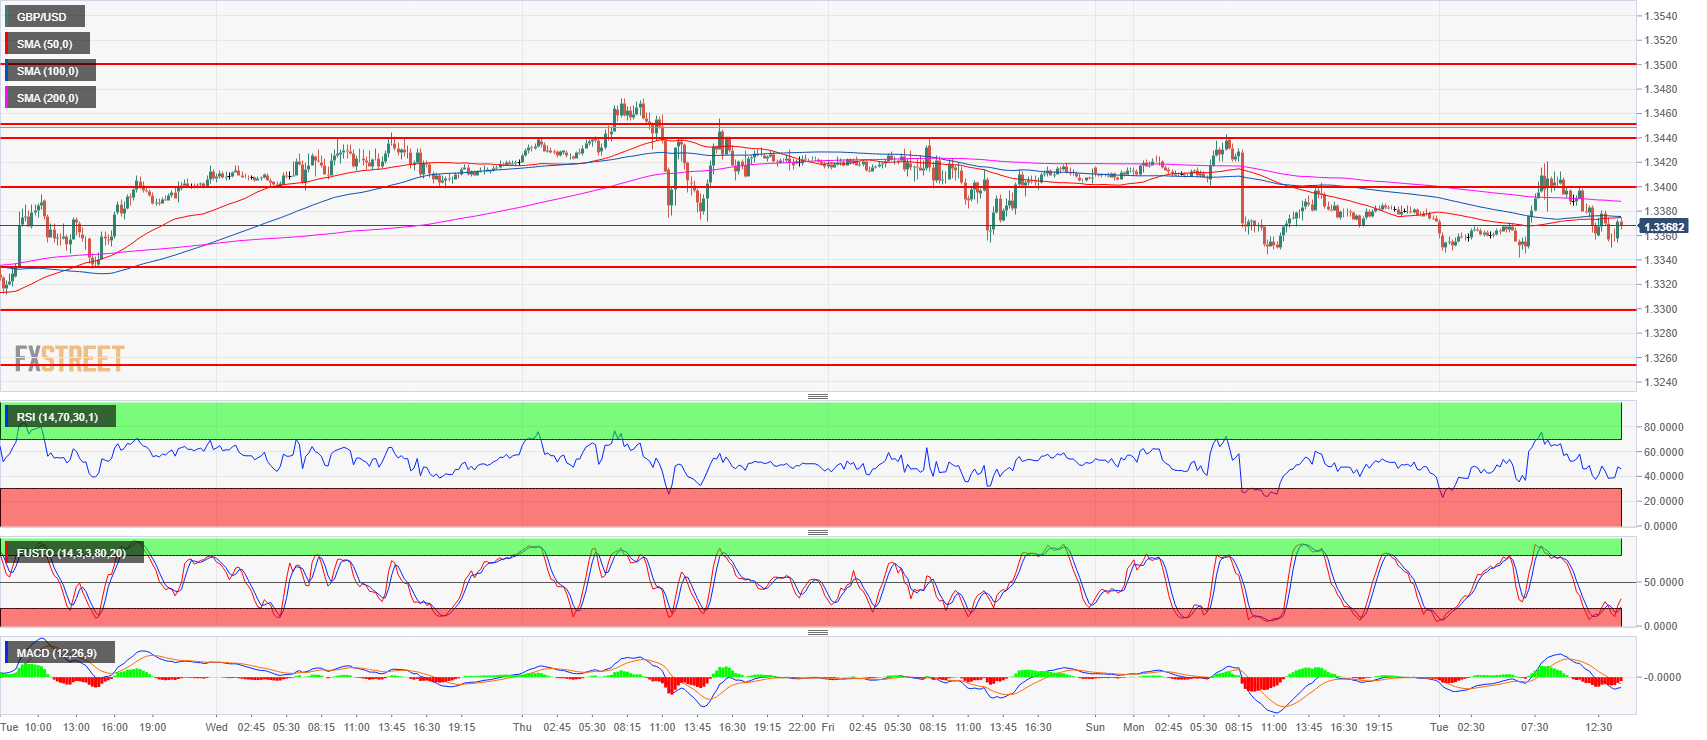
Spot rate:               1.3368
Relative change:    -0.07%     
High:                      1.3420
Low:                       1.3342

Trend:                    Neutral

Resistance 1:        1.3400 figure
Resistance 2:        1.3442 current Monday’s high  
Resistance 3:        1.3590 daily 200-period simple moving average
        
Support 1:             1.3344, daily 10-period SMA
Support 2:             1.3300 figure
Support 3:             1.3254 June 1 swing low

With core CPI on the rise, the Fed is set to hike tomorrow - ING

"Headline consumer price inflation rises to 2.8% in May with a strong chance it hits 3% in June. With core CPI on the rise, the Fed is set to hike tom
Đọc thêm Previous

GBP/JPY Technical Analysis: weakness below a confluence support lacks follow-through

   •  The cross weakened below a confluence region, comprising of 100-period SMA and a short-term ascending trend-line support on the 1-hourly chart.
Đọc thêm Next