EUR/USD pulls back after rallying to within sight of 1.1000
- EUR/USD is correcting back after a surge on Thursday that took it to the mid 1.0900s.
- The pair was boosted by the Fed sounding more likely to cut interest rates than the ECB.
- The uptrend remains intact and suggests more upside once the pullback expires.
EUR/USD is edging lower as traders book profits ahead of the weekend after a strong performance on Thursday, when bulls knocked on the door of 1.1000 for the first time since early January.
EUR/USD in uptrend as Fed more vociferous about interest-rate cuts
EUR/USD is broadly speaking in a short-term uptrend, propelled higher by prospects that the US Federal Reserve (Fed) is a fraction closer to lowering interest rates than the European Central Bank (ECB). A cut in interest rates is generally negative for a currency as it reduces foreign capital inflows.
Prior to the ECB meeting on Thursday, some analysts had highlighted April as a possible (if unlikely) candidate for initiating rate cuts. In her press conference after the ECB meeting, however, European Central Bank President Christine Lagarde said: “We have not discussed rate cuts at this meeting,” suggesting April is off the table. Her other comments indicated the ECB policymakers were not planning to seriously review this possibility until June, after more data is available.
On the contrary, Federal Reserve Chairman Jerome Powell seemed more dovish during his testimony to the Senate Banking Committee on Thursday. Powell said “we’re not far” from inflation falling to a level where it would be okay to start cutting rates.
On the horizon
With the ECB meeting and Powell’s testimony in the rear view mirror, the next key event for the EUR/USD will be US Nonfarm Payrolls (NFP) data, out on Friday at 13:30 GMT.
If US jobs data is soft, in line with the ADP, JOLTS and jobless claims from earlier in the week, it could suggest the time is coming closer to cut interest rates. This would weigh on the USD, giving EUR/USD another boost.
NFPs cannot be easily predicted, however, and are apt to surprise, sometimes going in the opposite direction to previous labor metrics such as ADP. The fact that certain employment-related indicators leading to the key Nonfarm Payrolls release were negative doesn’t mean that NFPs will follow suit.
Analysts are predicting headline Nonfarm Payrolls to come out at 200K extra jobs in February, the Unemployment Rate to remain steady at 3.7%, and the all-important Average Hourly Earnings figure to show 4.4% YoY rise and a 0.3% MoM advance.
Average Weekly Hours are expected to rise to 34.3 from 34.1, suggesting more full-time employees joining the army of US workers – which is generally taken as a positive for the economy and the US Dollar.
Technical Analysis: Euro overbought and pulling back
Turning to the charts, the EUR/USD has risen up to the 1.0900s from February’s base-camp 1.0600 lows. The sequence of rising peaks and troughs suggests that overall a tentative short-term uptrend is in progress, slightly favoring bulls.
There are, however, signs a pullback is unfolding. During the last eight hours, the Relative Strength Indicator (RSI) has exited the oversold zone, giving a sell signal. At the same time, the pair may have completed a three-wave ABC measured move pattern at the recent 1.0956 highs. This is further evidence a correction may be underway.
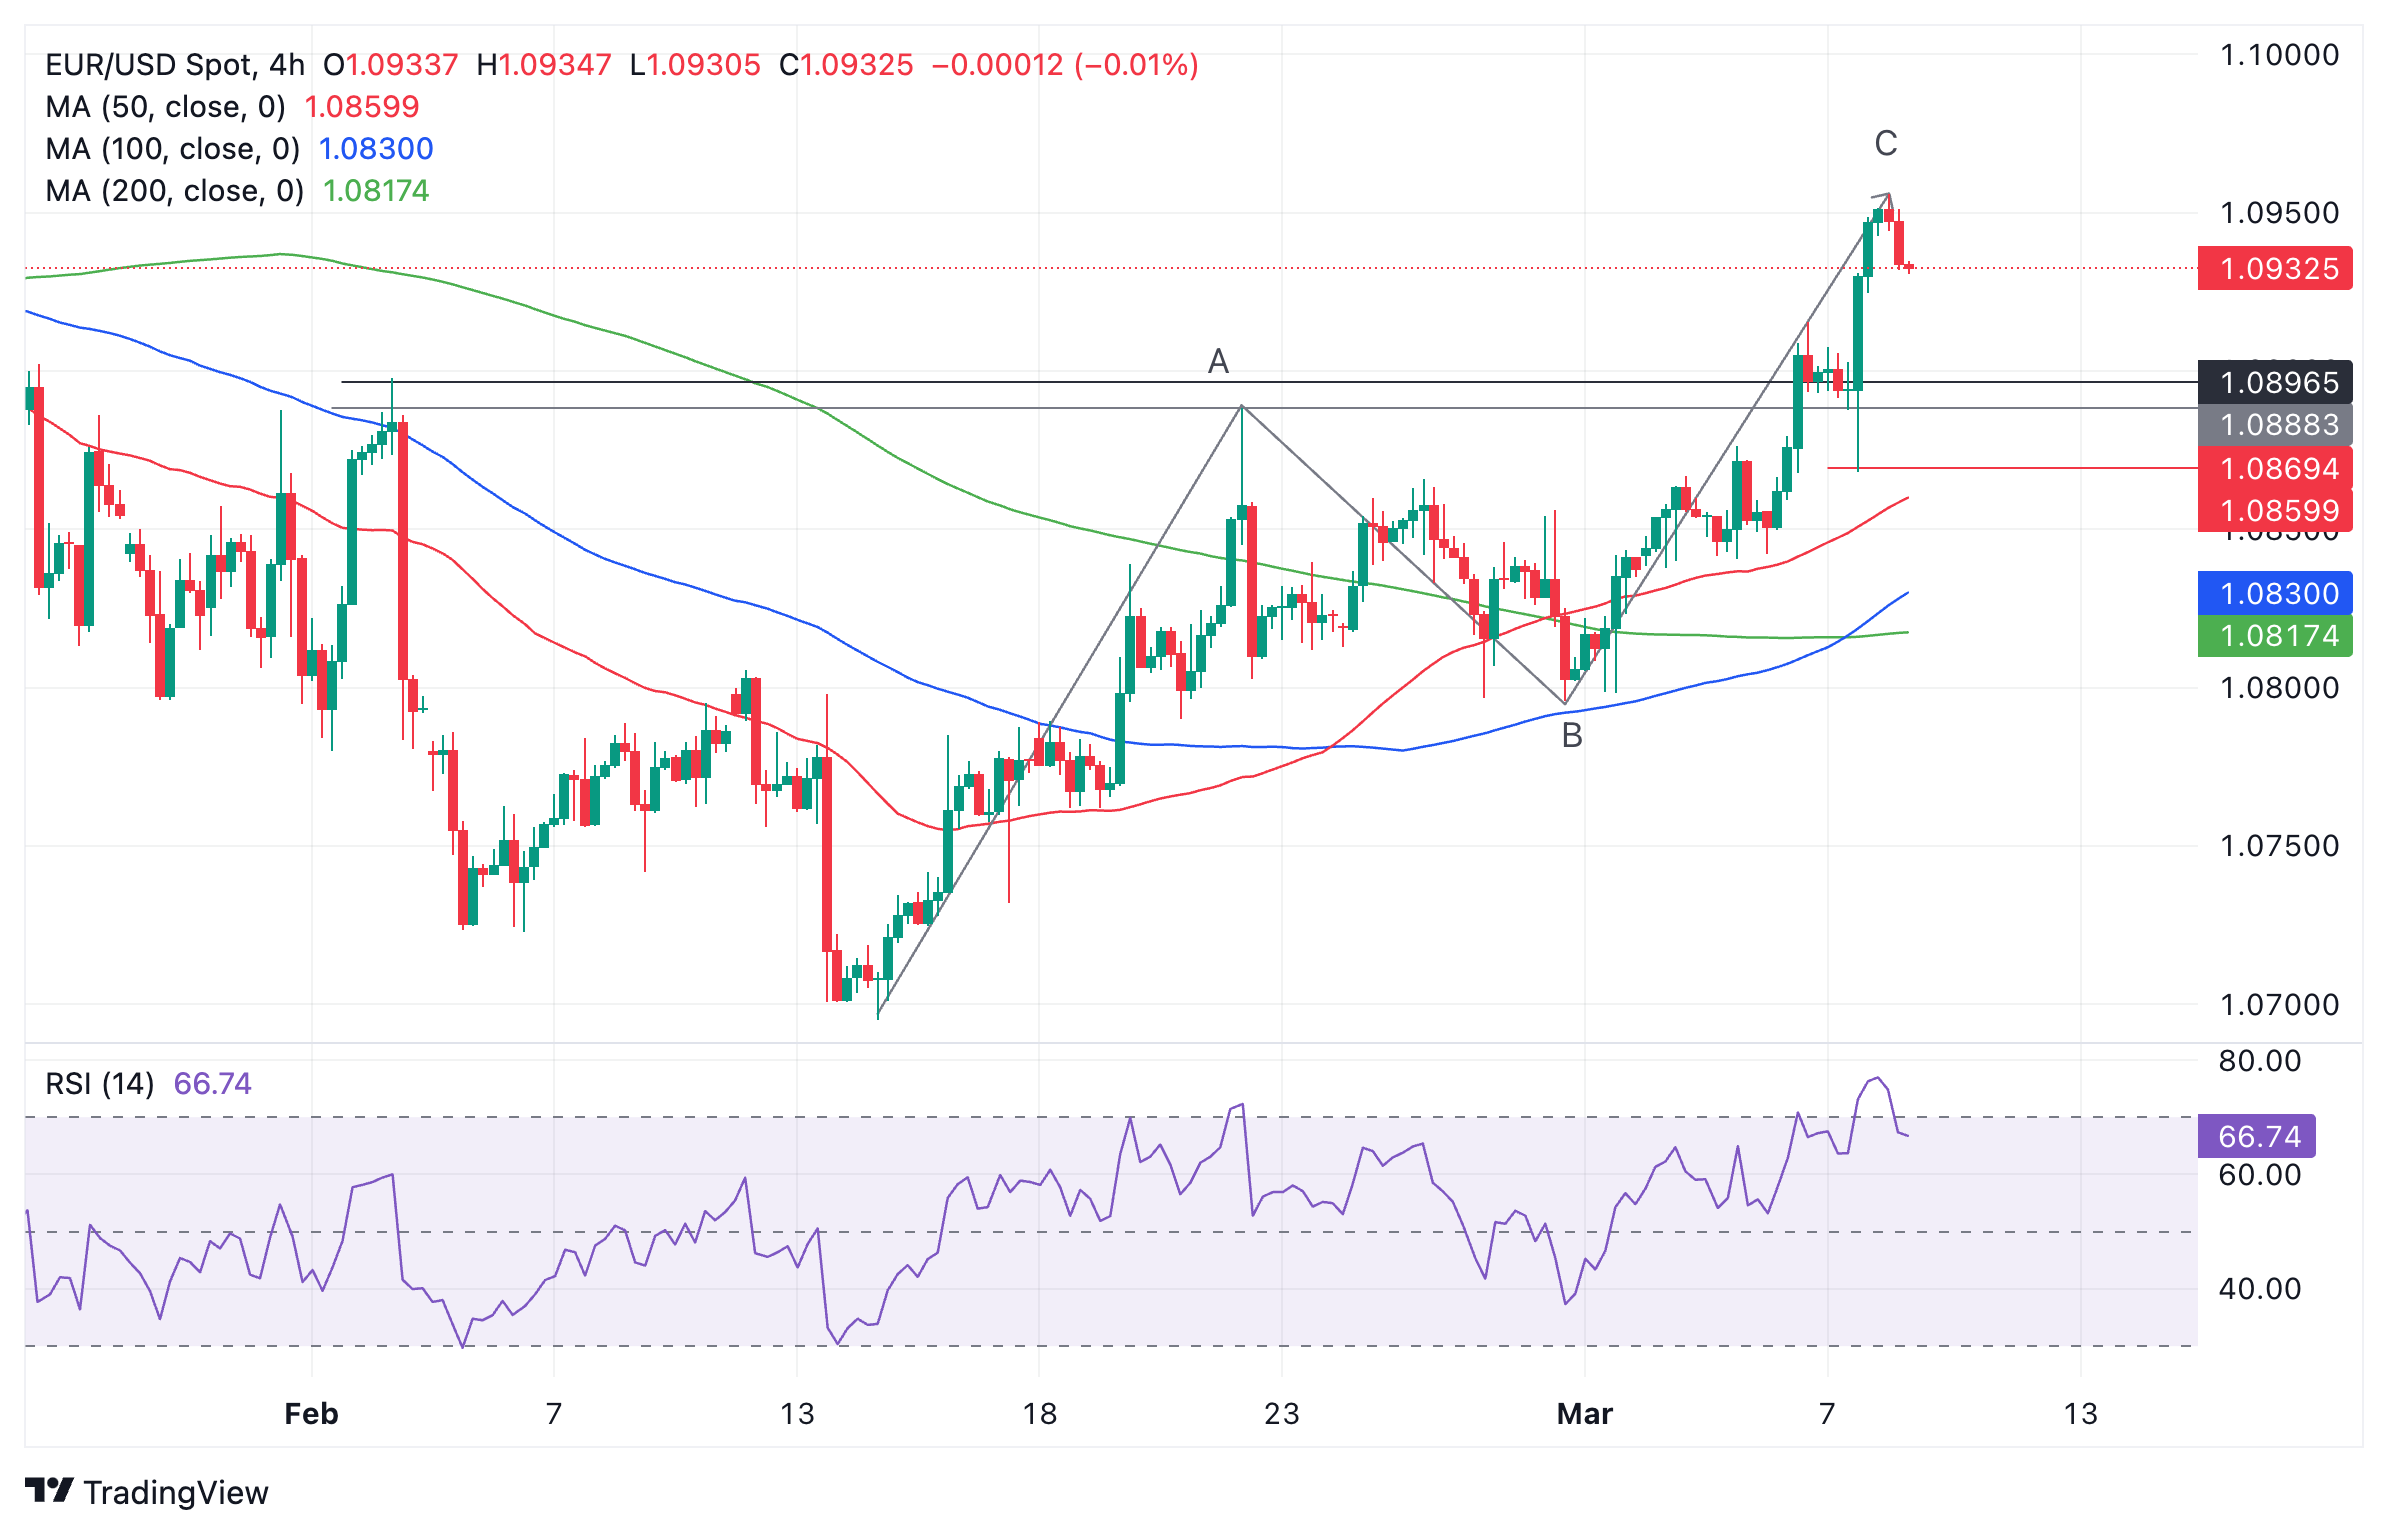
Euro vs US Dollar: 4-hour chart
Whilst these signs are still not enough to indicate a reversal of the short-term uptrend, they do recommend a pullback is underway. The most likely target for the correction to find support is in a zone between the 1.0898 February 2 high and the top of the A wave at 1.0888.
A break below the red line at Thursday’s 1.0867 lows would indicate a greater chance the pair was reversing.
The daily chart shows the pair is also probably now in an intermediate uptrend, although one pass higher after the current pullback would solidify that view.
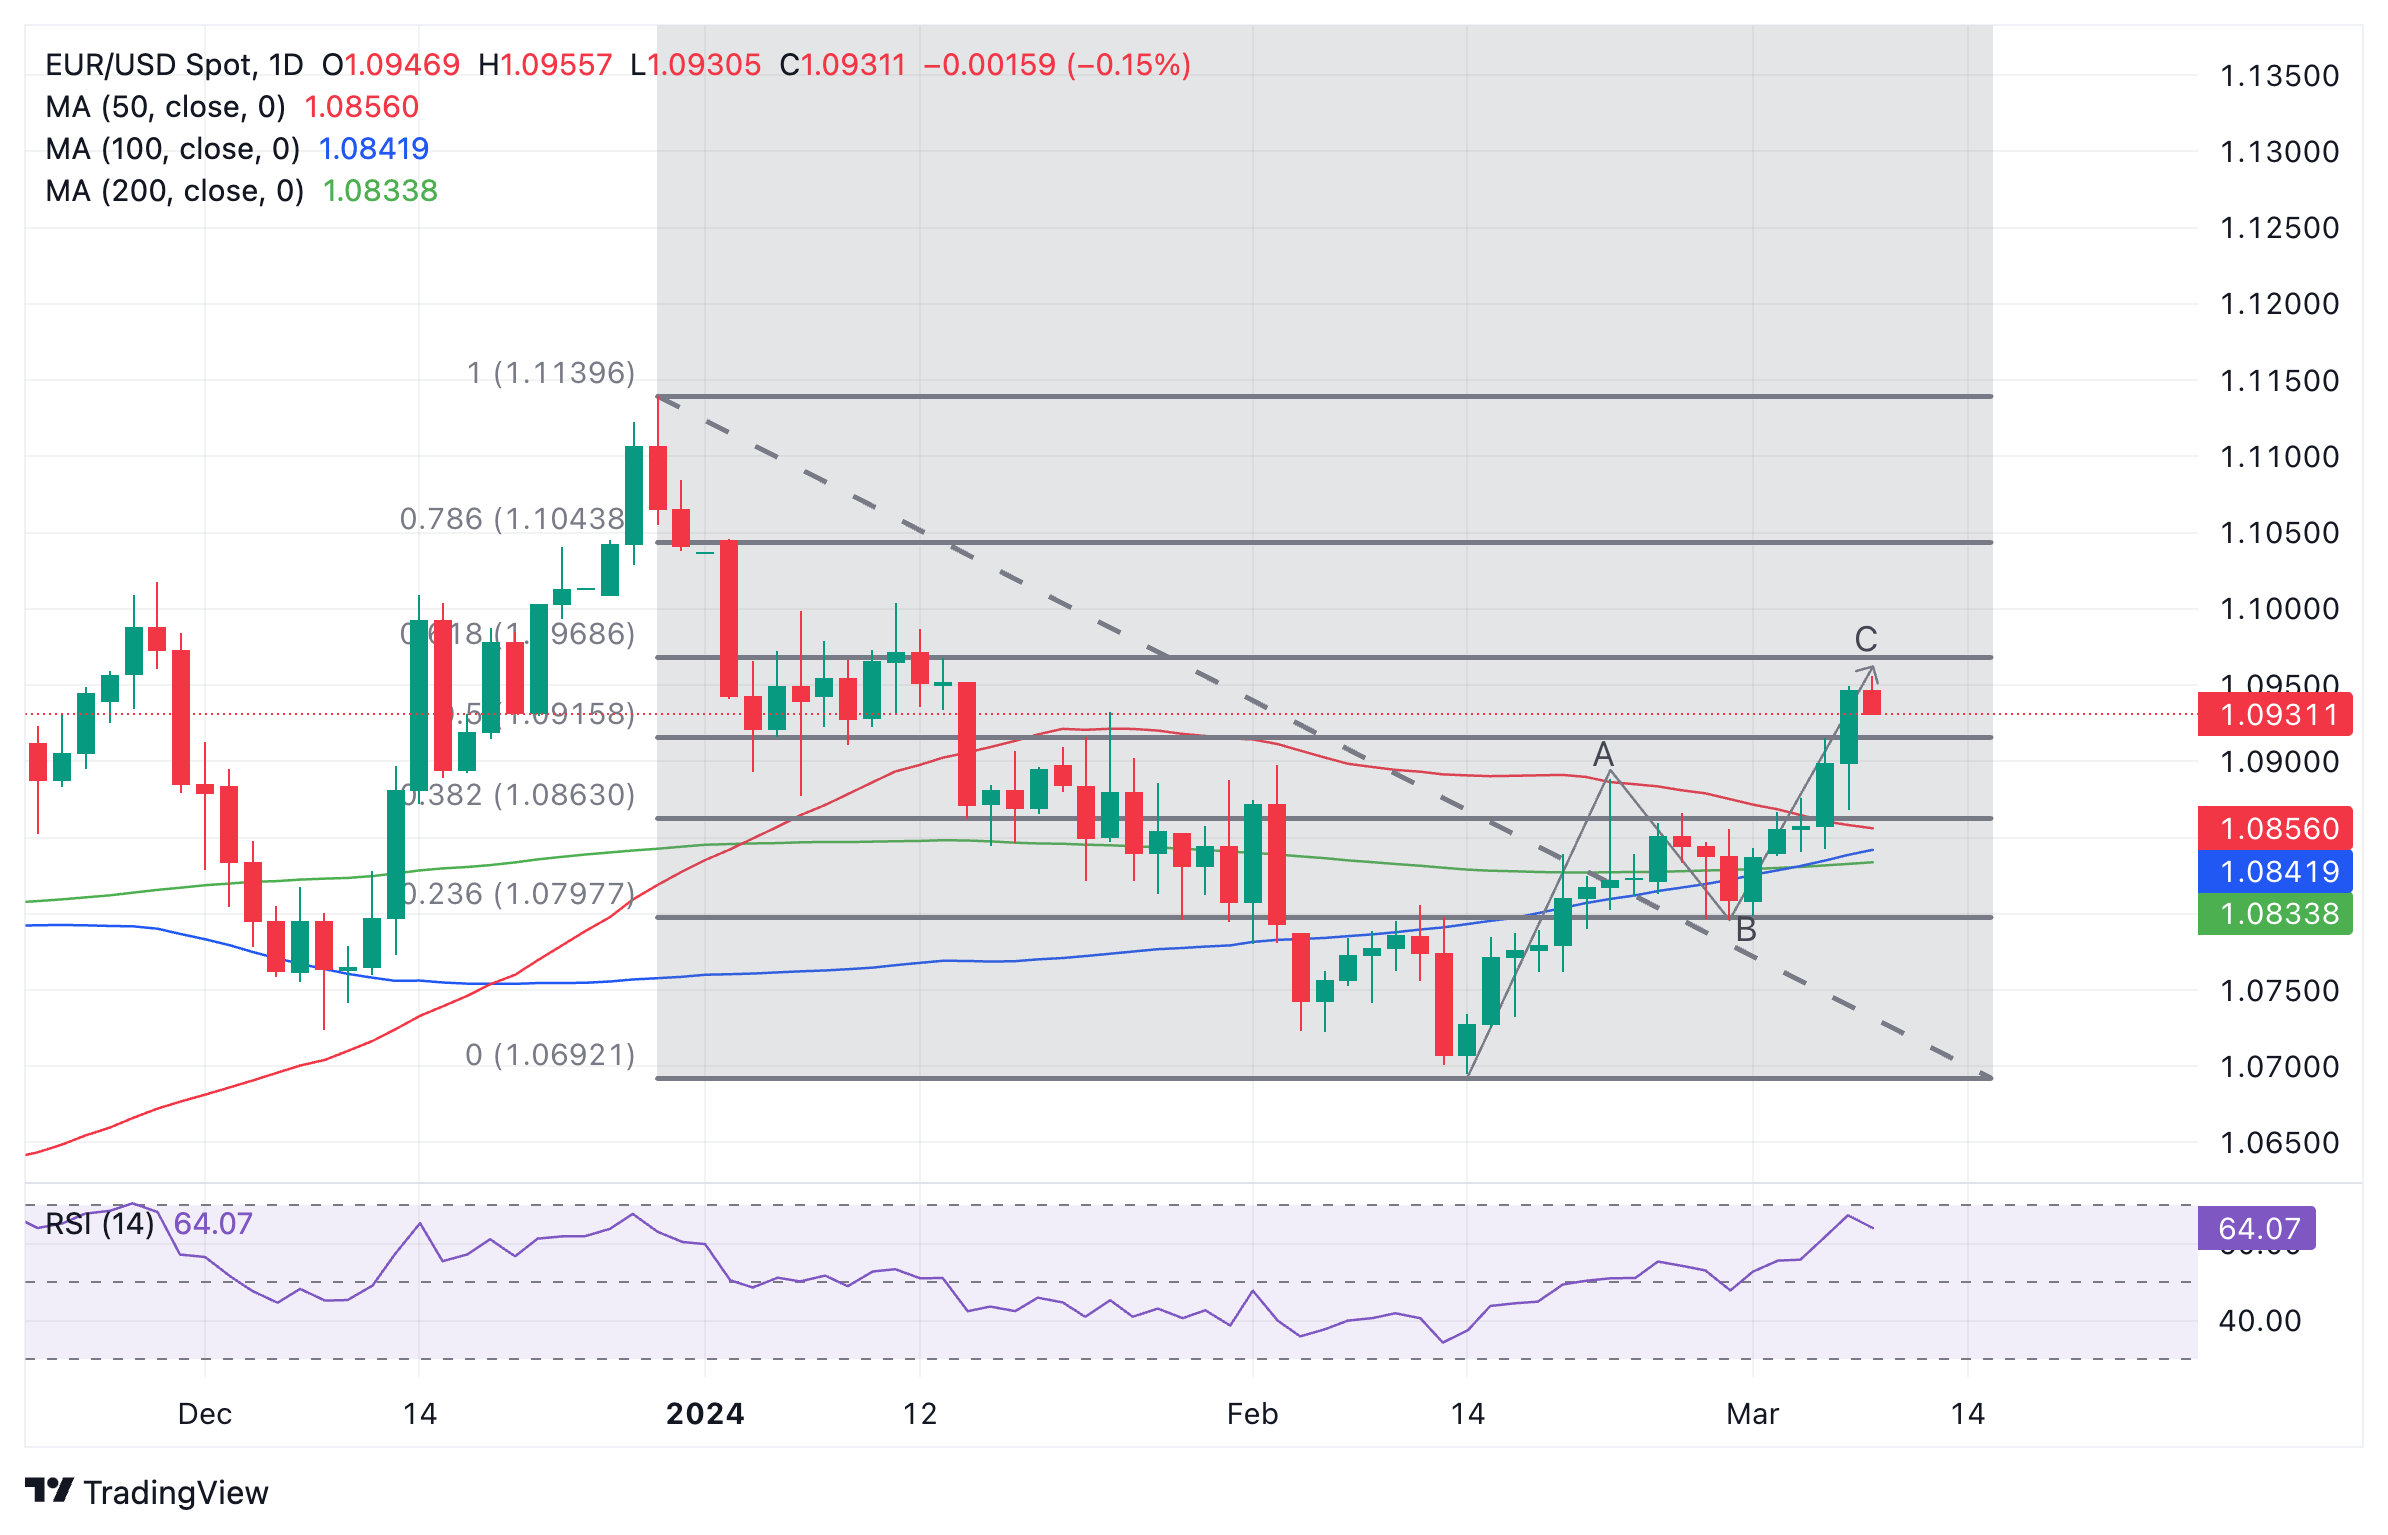
Euro vs US Dollar: 1-day chart
The RSI on the daily chart is not as overbought as on the 4-hour and indicates more upside is still possible before the party gets too rowdy.
The next target higher if the uptrend resumes is the key 0.618 Fibonacci retracement of the early 2024 decline, at 1.0972.
A break above that level would further encourage bulls to strike for the prize – 1.10 – an important psychological level, followed by 1.1043 at the 0.786 Fibonacci retracement.
A break beneath the 1.0795 lows would spoil the buyer’s party and indicate a vulnerability to break down.
The overall long-term trend is sideways and remains difficult to forecast.
Australian Dollar FAQs
What key factors drive the Australian Dollar?
One of the most significant factors for the Australian Dollar (AUD) is the level of interest rates set by the Reserve Bank of Australia (RBA). Because Australia is a resource-rich country another key driver is the price of its biggest export, Iron Ore. The health of the Chinese economy, its largest trading partner, is a factor, as well as inflation in Australia, its growth rate and Trade Balance. Market sentiment – whether investors are taking on more risky assets (risk-on) or seeking safe-havens (risk-off) – is also a factor, with risk-on positive for AUD.
How do the decisions of the Reserve Bank of Australia impact the Australian Dollar?
The Reserve Bank of Australia (RBA) influences the Australian Dollar (AUD) by setting the level of interest rates that Australian banks can lend to each other. This influences the level of interest rates in the economy as a whole. The main goal of the RBA is to maintain a stable inflation rate of 2-3% by adjusting interest rates up or down. Relatively high interest rates compared to other major central banks support the AUD, and the opposite for relatively low. The RBA can also use quantitative easing and tightening to influence credit conditions, with the former AUD-negative and the latter AUD-positive.
How does the health of the Chinese Economy impact the Australian Dollar?
China is Australia’s largest trading partner so the health of the Chinese economy is a major influence on the value of the Australian Dollar (AUD). When the Chinese economy is doing well it purchases more raw materials, goods and services from Australia, lifting demand for the AUD, and pushing up its value. The opposite is the case when the Chinese economy is not growing as fast as expected. Positive or negative surprises in Chinese growth data, therefore, often have a direct impact on the Australian Dollar and its pairs.
How does the price of Iron Ore impact the Australian Dollar?
Iron Ore is Australia’s largest export, accounting for $118 billion a year according to data from 2021, with China as its primary destination. The price of Iron Ore, therefore, can be a driver of the Australian Dollar. Generally, if the price of Iron Ore rises, AUD also goes up, as aggregate demand for the currency increases. The opposite is the case if the price of Iron Ore falls. Higher Iron Ore prices also tend to result in a greater likelihood of a positive Trade Balance for Australia, which is also positive of the AUD.
How does the Trade Balance impact the Australian Dollar?
The Trade Balance, which is the difference between what a country earns from its exports versus what it pays for its imports, is another factor that can influence the value of the Australian Dollar. If Australia produces highly sought after exports, then its currency will gain in value purely from the surplus demand created from foreign buyers seeking to purchase its exports versus what it spends to purchase imports. Therefore, a positive net Trade Balance strengthens the AUD, with the opposite effect if the Trade Balance is negative.